bert 无标记文本 调优
介绍 (Introduction)
Kaggle released Q&A understanding competition at the beginning of 2020. This competition asks each team to build NLP models to predict the subjective ratings of question and answer pairs. We finished it with 6th place in all 1571 teams. Apart from a winning solution blog posted in Kaggle, we write this more beginner friendly tutorial to introduce the competition and how we won the gold medal. We also open source our code in this Github repository.
Kaggle在2020年初发布了Q&A理解竞赛 。该竞赛要求每个团队构建NLP模型,以预测问题和答案对的主观评分。 我们在1571个团队中均排名第六。 除了在Kaggle 上发布的获奖解决方案博客之外,我们还编写了这个对初学者更友好的教程,以介绍比赛以及我们如何获得金牌。 我们还在这个 Github存储库中开源了我们的代码。
数据 (Data)
The competition collects question and answer pairs from 70 Stack-Overflow-like websites, Question title, body and answer as text features, also some other features such as url, user id. The target labels are 30 dimensions with values between 0 and 1 to evaluate questions and answer such as if the question is critical, if the answer is helpful, etc. The raters received minimal guidance and training, and the target relied largely on their subjective interpretation. In other words, the target score is simply from raters common-sense. The target variables were the result of averaging the classification of multiple raters. i.e. if there are four raters, one classifies it a positive and the other three as a negative, the target value will be 0.25.
比赛从70个类似Stack-Overflow的网站收集问题和答案对,问题标题,正文和答案作为文本特征,还包括其他一些特征,例如url,用户ID。 目标标签为30个维度,值在0到1之间,用于评估问题和答案,例如问题是否关键,答案是否有帮助等。评分者仅获得了最少的指导和培训,目标很大程度上取决于他们的主观解释。 换句话说,目标分数仅来自评估者的常识。 目标变量是对多个评估者的分类进行平均的结果。 例如,如果有四个评估者,一个评估者为正,其他三个评估为负,则目标值为0.25。
Here is an example of the question
这是一个问题的例子
Question title: What am I losing when using extension tubes instead of a macro lens?
问题标题 : 使用延长管代替微距镜头时我会失去什么?
Question body: After playing around with macro photography on-the-cheap (read: reversed lens, rev. lens mounted on a straight lens, passive extension tubes), I would like to get further with this. The problems with …
问题主体 : 在便宜地进行微距摄影(阅读:倒置镜头,将镜头安装在直镜头上,无源延长管)玩完后,我想进一步介绍一下。 …的问题
Answer: I just got extension tubes, so here’s the skinny. …what am I losing when using tubes…? A very considerable amount of light! Increasing that distance from the end of the lens to the sensor …
答 : 我只有延长管,所以这里很瘦。 …使用电子管时我会失去什么? 非常大量的光! 从镜头末端到传感器的距离增加了……
The training and test set are distributed as below
训练和测试集的分布如下
评估指标 (Evaluation metrics)
Spearman’s rank correlation coefficient is used as the evaluation metrics in this competition.
Spearman等级相关系数用作本次比赛的评估指标。
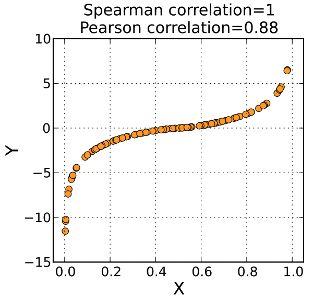
Intuitively, Pearson correlation is a measure of linear correlation of X and Y. For Spearman’s rank correlation, instead of using the value of X and Y, we use the ranking of X and Y in the formula. It is a measure of the monotonic relationship between X and Y. As the figure shown, the data given in the chart, pearson is 0.88 and spearman is 1.
直观上,Pearson相关性是X和Y的线性相关性的度量。对于Spearman的秩相关,我们在公式中使用X和Y的排名,而不是使用X和Y的值。 它是X和Y之间单调关系的度量。如图所示,图表中给出的数据,pearson为0.88,spearman为1。
Why was spearman used in this kaggle competition? Considering the subjective and noisy nature of the labels, Spearman correlation tends to be more robust to outliers as for instance pearson correlation. Also, because the target value is an understanding of question and answer based on rater’s common sense. Suppose we have 3 answers and we evaluate if the answers are well-written. answer A has score 0.5, answer B has score 0.2 and answer C is 0.1, If we claim answer A is 0.3 better than answer B, does it make sense? Not really. Here, we do not need the accurate value difference. It is just enough to know A is better than B and B is better than C.
为什么在这项kaggle比赛中使用了spearman? 考虑到标签的主观性和嘈杂性,Spearman相关性趋向于对离群值更稳健,例如earson相关性。 此外,因为目标值是基于评估者的常识来理解问答。 假设我们有3个答案,并且我们评估答案是否写得好。 答案A的得分为0.5,答案B的得分为0.2,答案C的得分为0.1,如果我们认为答案A比答案B的得分高0.3,这有意义吗? 并不是的。 在这里,我们不需要精确的值差。 仅仅知道A优于B并且B优于C就足够了。
source: https://en.wikipedia.org/wiki/Spearman%27s_rank_correlation_coefficient 来源: https : //zh.wikipedia.org/wiki/Spearman%27s_rank_correlation_coefficientNLP管道 (NLP Pipeline)
Image by author) 图片由作者 )A general NLP pipeline is shown as the figure above. And a typical non-neural network-based solution could be:
常规NLP管道如上图所示。 典型的基于非神经网络的解决方案可能是:
- Use TF-IDF or word-embedding to get the token based vector representations 使用TF-IDF或词嵌入来获取基于令牌的矢量表示
- Average the token vectors to a get document vector representation 将令牌向量平均化为获取文档向量表示
- Use random forest or lightGBM as the classifier or the regressor 使用随机森林或lightGBM作为分类器或回归器
Due to the emergence of transformer and BERT in 2017 and 2018, NLP has been experiencing an “ImageNet” moment. BERT has become the dominant algorithm for NLP competitions. In this blog, we do not introduce BERT. There are several good tutorials such as here, here and here.
由于2017年和2018年变压器和BERT的出现,NLP一直处于“ ImageNet”时代。 BERT已成为NLP比赛的主要算法。 在此博客中,我们不介绍BERT。 有几个很好的教程,例如在这里 , 这里和这里 。
Now, we can restructure the NLP pipeline by using BERT:
现在,我们可以使用BERT重构NLP管道:
- Use BERT wordpiece tokenizer to generate (sub)word tokens 使用BERT词片标记器生成(子)词标记
- Generate embedding vectors per token from BERT 从BERT生成每个令牌的嵌入向量
- Average the token vectors by a neural network pooling layer 通过神经网络池化层平均令牌向量
- Use feed forward layers as the classifier or regressor 使用前馈层作为分类器或回归器
金牌解决方案 (Gold Medal Solution)
大图 (The big picture)
As illustrated in the figure below, we use four BERT-based models and a Universal Sentence Encoder model as base models, then stack them to generate the final result. In the rest of this blog, we will only focus on the transformer/BERT models. For more information of Universal Sentence Encoder, you can visit the original paper here, and the code is available here.
如下图所示,我们使用四个基于BERT的模型和一个通用语句编码器模型作为基础模型,然后将它们堆叠以生成最终结果。 在本博客的其余部分中,我们将仅关注变压器/ BERT模型。 有关通用语句编码器的更多信息,您可以在此处访问原始论文,并且代码可以在此处获得 。
Image by author) 图片由作者 )基于BERT的模型的架构 (Architecture of BERT-based models)
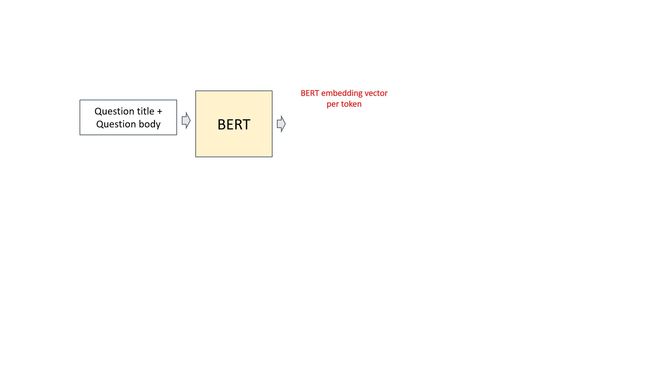
The animation below shows how one base model works. The codes are here.
下面的动画显示了一个基本模型的工作原理。 代码在这里 。
- Question title and question body are concatenated as input. BERT tokenizer is used to get sub-words, then BERT embeddings are generated. Followed by an average pooling layer, we get a vector representation for each question title and body pair. It is noted that we averaged over the token embeddings of non-masked tokens. It was something we did different from the common approaches and made a slight improvement in cross-validation. Other categorical or numerical features are appended, then connected with a linear layer with Gelu activation and dropout. 问题标题和问题正文被串联为输入。 BERT令牌生成器用于获取子词,然后生成BERT嵌入。 接下来是平均池化层,我们获得每个问题标题和正文对的向量表示。 注意,我们对非掩码令牌的令牌嵌入取平均值。 我们所做的与常规方法有所不同,并且在交叉验证方面做了些微改进。 附加其他类别或数字特征,然后通过Gelu激活和退出与线性层连接。
- Similarly, we have a mirror structure with question titles and answer pairs as input. We have two options. If the mirror BERT model can share the weights of the first BERT model, we call it “siamese” structure. It can also use separate weights, then we call it “double” structure. The siamese structure normally has less parameters and better generalization. We experimented with both siamese and double structure and choose the best N base models according to cross-validate scores. 同样,我们有一个镜像结构,其中以问题标题和答案对为输入。 我们有两个选择。 如果镜像BERT模型可以共享第一个BERT模型的权重,我们将其称为“暹罗”结构。 它还可以使用单独的权重,因此我们将其称为“双重”结构。 暹罗结构通常具有较少的参数和更好的概括性。 我们对暹罗和双重结构进行了实验,并根据交叉验证得分选择了最佳的N基模型。
- The output of both aforementioned structures are concatenated, and connected to a forward layer to get the prediction of 30 dimensional target value. 将上述两个结构的输出连接起来,并连接到前向层,以预测30维目标值。
Huggingface packages most state-of-the-art NLP models Pytorch implementations. In our solution, 4 BERT based models implemented by Huggingface are selected. They are Siamese Roberta base, Siamese XLNet base, Double Albert base V2, Siamese BERT base uncased.
Huggingface打包了大多数最新的NLP模型Pytorch实现。 在我们的解决方案中,选择了4种由Huggingface实现的基于BERT的模型。 他们是连体罗伯塔基地,连体XLNet基地,双伟业基地V2,连体BERT基地无套管。
Image by author) 作者提供的图片 )培训和实验设置 (Training and experiment setup)
We have two stage training. Stage 1 is an end-to-end parameter tuning, and stage 2 only tunes the “head”.
我们有两个阶段的培训。 阶段1是端到端的参数调整,阶段2仅调整“头部”。
in the first stage:
在第一阶段:
Train for 4 epochs with huggingface AdamW optimiser. The code is here
训练用adamW优化器进行4个时期的训练。 代码在这里
- Binary cross-entropy loss. 二进制交叉熵损失。
One-cycle LR schedule. Uses cosine warmup, followed by cosine decay, whilst having a mirrored schedule for momentum (i.e. cosine decay followed by cosine warmup). The code is here
一周期LR时间表。 使用余弦预热,然后进行余弦衰减,同时具有动量的镜像计划(即,余弦衰减后进行余弦预热)。 代码在这里
- Max LR of 1e-3 for the regression head, max LR of 1e-5 for transformer backbones. 回归头的最大LR为1e-3,变压器主干的最大LR为1e-5。
- Accumulated batch size of 8 累计批量大小为8
In the second stage:
在第二阶段:
Freeze transformer backbone and fine-tune the regression head for an additional 5 epochs with constant LR of 1e-5. The code is here
冻结变压器主干并微调回归头,使LR恒定为1e-5的另外5个时期。 代码在这里
- Added about 0.002 to CV for most models. 大多数型号的CV增加了0.002。
堆码 (Stacking)
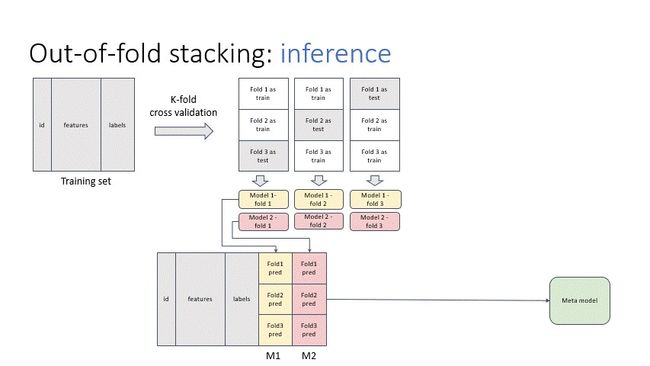
Stacking is the “de-facto” ensemble strategy for kagglers. The animations below illustrate the training and prediction procedure. there are 3 folds in the example. To get the meta training data for each fold, we train iteratively on 2 folds and predict on the remaining fold. And the whole out-of-fold prediction is used as features. Then, we train the stacking model.
堆叠是kaggler的“实际”合奏策略。 下面的动画说明了训练和预测过程。 示例中有3折。 为了获得每个折叠的元训练数据,我们在2个折叠上进行迭代训练,并预测剩余的折叠。 并且将整个失叠预测用作特征。 然后,我们训练堆叠模型。
In the prediction stage, we input the test data to all out-of-fold base models to get the predictions. Then, we average the results, pass to the stacking model to get the final prediction.
在预测阶段,我们将测试数据输入到所有折衷的基础模型中以获取预测。 然后,我们将结果取平均值,然后传递到堆叠模型以获得最终预测。
其他技巧 (Other tricks)
GroupKFold (GroupKFold)
Let us first have a look why normal KFold split does not work well in this competition. In the dataset, some samples were collected from one question-answer thread, which means multiple samples share the same question title and body but with different answers.
首先让我们看一下为什么普通的KFold拆分在本次比赛中效果不佳。 在数据集中,从一个问答线程中收集了一些样本,这意味着多个样本共享相同的标题和正文,但答案不同。
If we use a normal KFold split function, answers to the same questions will be distributed in both training set and test set. This will bring an information leakage problem. A better split is to put all question/answer pairs from the same question together in either the training set or the test set.
如果我们使用普通的KFold拆分功能,则对相同问题的答案将同时分布在训练集和测试集中。 这将带来信息泄漏问题。 更好的划分是将来自同一问题的所有问题/答案对放到训练集或测试集中。
Fortunately, sk-learn has provided a function GroupKFold to generate non-overlapping groups for cross validation. Question body field is used to indicate the group, as the code below.
幸运的是,sk-learn提供了一个功能GroupKFold来生成非重叠组以进行交叉验证。 问题正文字段用于指示组,如下代码所示。
后期处理 (Post-processing)
As many other teams did, one post-processing step had a massive impact on the performance. The general idea is based on rounding predictions downwards to a multiple of some fraction 1/d.
与其他许多团队一样,一个后处理步骤对性能产生了巨大影响。 总体思路是基于将预测向下舍入到1 / d的倍数的倍数。
So if d=4 and x = [0.12, 0.3, 0.31, 0.24, 0.7] these values will get rounded to [0.0, 0.25, 0.25, 0.0, 0.5]. For each target column we did a grid search for values of d in [4, 8, 16, 32, 64, None].
因此,如果d = 4且x = [0.12,0.3,0.31,0.24,0.7],则这些值将四舍五入为[0.0,0.25,0.25,0.0,0.5]。 对于每个目标列,我们在[4,8,16,32,64,None]中进行了d值的网格搜索。
In our ensemble we exploited this technique even further, applying the rounding first to individual model predictions and again after taking a linear combination of model predictions. In doing so we did find that using a separate rounding parameter for each model, out-of-fold score improvements would no longer translate to leaderboard. We addressed this by reducing the number of rounding parameters using the same d_local across all models:
在我们的合奏中,我们甚至进一步利用了该技术,首先将舍入应用于单个模型预测,然后在对模型预测进行线性组合之后再次应用。 通过这样做,我们确实发现,对于每个模型使用单独的舍入参数,失格得分的提高将不再转化为排行榜。 我们通过在所有模型中使用相同的d_local减少舍入参数的数量来解决此问题:
All ensembling parameters — 2 rounding parameters and model weights — were set using a small grid search optimising the spearman rank correlation coefficient metric on out-of-fold while ignoring question targets for rows with duplicate questions. In the end, this post-processing improved our 10 fold GroupKFold CV by ~0.05.
所有合奏参数(2个舍入参数和模型权重)均使用小网格搜索进行设置,这些搜索优化了失叠的Spearman等级相关系数度量,而忽略了具有重复问题的行的问题目标。 最后,此后处理使我们的10倍GroupKFold CV改善了〜0.05。
Zhe Sun, Robin Niesert, Ahmet Erdem and Jing Qin
孙哲,罗宾·尼瑟特,艾哈迈德·埃德姆和静琴
翻译自: https://towardsdatascience.com/accurately-labeling-subjective-question-answer-content-using-bert-bffe7c6e7c4
bert 无标记文本 调优


