【Opencv】图像分割——区域生长
文章目录
- 1 环境
- 2 效果
- 3 原理
- 4 案例
1 环境
- Python 3.8.8
- PyCharm 2021
- opencv-python
2 效果
3 原理
区域生长的基本思想是将具有相似性质的像素集合起来构成区域。具体先对每个需要分割的区域找一个种子像素作为生长的起点,然后将种子像素周围邻域中与种子像素具有相同或相似性质的像素(根据某种事先确定的生长或相似准则来判定)合并到种子像素所在的区域中。将这些新像素当做新的种子像素继续进行上面的过程,直到再没有满足条件的像素可被包括进来,这样,一个区域就长成了。
区域生长的算法实现:
- 根据图像的不同应用选择一个或一组种子,它或者是最亮或最暗的点,或者是位于点簇中心的点,当然也可以手动选择种子点。
- 选择一个描述符(条件),常见的有基于区域灰度差、基于区域灰度分布统计性质。
- 从该种子开始向外扩张,首先把种子像素加入结果集合,然后不断将与集合中各个像素连通、且满足描述符的像素加入集合。
- 上一过程进行到不再有满足条件的新结点加入集合为止。
4 案例
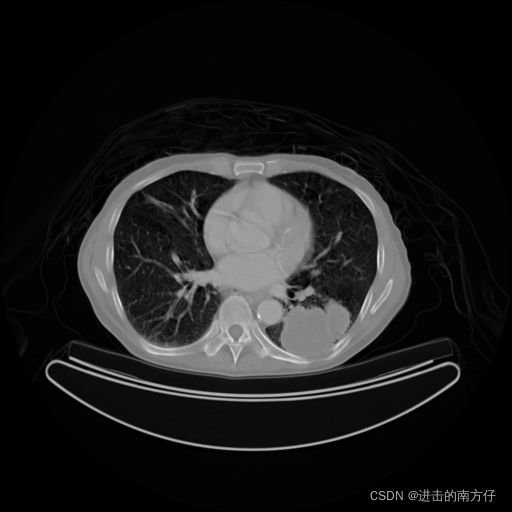
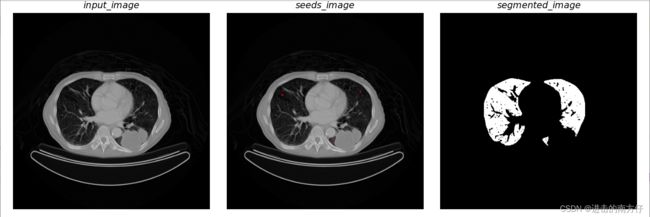
本次案例采用了一张医学图像,为肺部 CT 图像,提取肺的轮廓以判断肺的健康性。
- 读入CT图片,让图片和鼠标进行交互,在三个位置进行左击鼠标生成三个红点,保存每次点击时的 ( y , x ) (y,x) (y,x) 到开始的 s e e d s seeds seeds 中,完成 s e e d s seeds seeds 初始化。完成此过程的为 c v 2. s e t M o u s e C a l l b a c k ( ) cv2.setMouseCallback() cv2.setMouseCallback()。
- 以上面步骤得到的 s e e d s seeds seeds 进行区域生长,创建与原 C T CT CT 图大小相同的空白图 s e e d M a r k seedMark seedMark,根据初始化的种子点的坐标在 s e e d M a r k seedMark seedMark 标记为 255 255 255。在定义种子点的八领域坐标,当种子与其八邻域的像素差大于 6 6 6 且之前在 s e e d M a r k seedMark seedMark 没有被标记过时,则不合并,反之将其与种子进行合并,方式为令 s e e d M a r k seedMark seedMark 的对应坐标的像素为 255 255 255,并将其存入种子队列作为下次生长时的种子,将当前种子点从种子队列中去除。
- 输入 q q q 回车结束交互,效果展示。
代码:
import cv2 as cv
import numpy as np
import matplotlib.pyplot as plt
from collections import deque

# 计算种子点和其领域的像素值之差
def getGrayDiff(gray, current_seed, tmp_seed):
    return abs(int(gray[current_seed[0], current_seed[1]]) - int(gray[tmp_seed[0], tmp_seed[1]]))

# 区域生长算法
def regional_growth(gray, seeds):
	#八领域
    connects = [(-1, -1), (0, -1), (1, -1), (1, 0), \
                (1, 1), (0, 1), (-1, 1), (-1, 0)]
    seedMark = np.zeros((gray.shape))
    height, width = gray.shape
    threshold = 6
    seedque = deque()
    label = 255
    seedque.extend(seeds)

    while seedque :
    	#队列具有先进先出的性质。所以要左删
        current_seed = seedque.popleft()
        seedMark[current_seed[0], current_seed[1]] = label
        for i in range(8) :
            tmpX = current_seed[0] + connects[i][0]
            tmpY = current_seed[1] + connects[i][1]
            #处理边界情况
            if tmpX < 0 or tmpY < 0 or tmpX >= height or tmpY >= width :
                continue

            grayDiff = getGrayDiff(gray, current_seed, (tmpX, tmpY))
            if grayDiff < threshold and seedMark[tmpX, tmpY] != label :
                seedque.append((tmpX, tmpY))
                seedMark[tmpX, tmpY] = label
    return seedMark

#交互函数
def Event_Mouse(event, x, y, flags, param) :
	#左击鼠标
    if event == cv.EVENT_LBUTTONDOWN :
    	#添加种子
        seeds.append((y, x))
        #画实心点
        cv.circle(img, center = (x, y), radius = 2,
                  color = (0, 0, 255), thickness = -1)

def Region_Grow(img):
    cv.namedWindow('img')
    cv.setMouseCallback('img', Event_Mouse)
    cv.imshow('img', img)

    while True :
        cv.imshow('img', img)
        if cv.waitKey(1) & 0xFF == ord('q') :
            break
    cv.destroyAllWindows()


    CT = cv.imread('images/CT.png', 1)
    seedMark = np.uint8(regional_growth(cv.cvtColor(CT, cv.COLOR_BGR2GRAY), seeds))

    cv.imshow('seedMark', seedMark)
    cv.waitKey(0)

    plt.figure(figsize=(12, 4))
    plt.subplot(131), plt.imshow(cv.cvtColor(CT, cv.COLOR_BGR2RGB))
    plt.axis('off'), plt.title(f'$input\_image$')
    plt.subplot(132), plt.imshow(cv.cvtColor(img, cv.COLOR_BGR2RGB))
    plt.axis('off'), plt.title(f'$seeds\_image$')
    plt.subplot(133), plt.imshow(seedMark, cmap='gray', vmin = 0, vmax = 255)
    plt.axis('off'), plt.title(f'$segmented\_image$')
    plt.tight_layout()
    plt.show()

if __name__ == '__main__':
    img = cv.imread('./images/CT.png')
    seeds = []
    Region_Grow(img)


