学会这个python库,几个项目就摸清了这个套路
CSDN话题挑战赛第1期
活动详情地址:https://marketing.csdn.net/p/bb5081d88a77db8d6ef45bb7b6ef3d7f
参赛话题:Python精彩第三方模块推荐
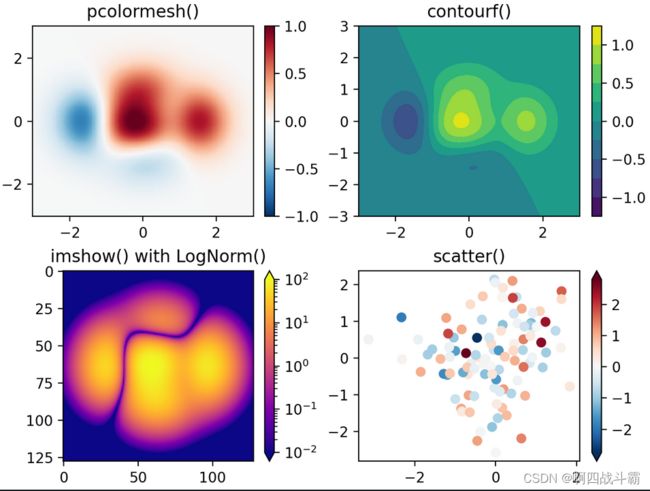
话题描述:Matplotlib库以渐进、交互式方式实现数据可视化,使数据更直观,使其一目了然,下面结合实际项目绘制几种常见的图形类型。
个性签名:整个建筑最重要的是地基,地基不稳,地动山摇。而学技术更要扎稳基础,关注我,带你稳扎每一板块邻域的基础。
博客主页:啊四战斗霸的博客
收录专栏:Python三剑客之江湖云
南来的北往的,走过路过千万别错过,错过本篇,“精彩”可能与您失之交臂yo
Triple attack(三连击):Comment,Like and Collect—>Attention
文章目录
-
- 1、Matplotlib库的简介
- 2、Matplotlib库的基础使用
- 3、Matplotlib项目实战
-
- 项目1:绘制折线图与柱状图实战
-
-
-
- 函数hist()——用于绘制折线图
- 函数bar()——用于绘制柱状图
-
-
- 项目2:绘制饼状图实战
-
-
-
- 函数pie()——用于绘制饼状图
-
-
- 项目3:绘制散点图实战
-
-
-
- 函数scatter() ——寻找变量之间的关系
-
-
- 项目4:绘制气泡图实战
-
-
-
- 函数scatter()——用于绘制气泡图
-
-
- 4、学习分享
1、Matplotlib库的简介
Matplotlib库是python优秀的数据可视化库,是python数据分析必备利器,出色的数据可视化会让你的数据分析等工作锦上添花,同时你也会感受到数据可视化之美。在现实世界中总会存在各种数值数据,我们想将这些数值数据编码成图、线、点、条等,以便直观地显示这些数值中包含的信息,同时可以使复杂分布的数据更容易被理解和应用。这一过程被广泛应用于各种场合之中,包括对比分析、增长率跟踪、市场分布、民意调查等。

2、Matplotlib库的基础使用
使用pylab或pyplot绘图的一般过程为:
首先生成或读入数据,然后根据实际需要绘制折线图、散点图、柱状图、饼状图、雷达图或三维曲线和曲面,接下来设置:
- 坐标轴标签(可以使用matplotlib.pyplot模块的xlabel()、ylabel()
- 函数或轴域的set_xlabel()、set_ylabel()方法)
- 坐标轴刻度(可以使用matplotlib.pyplot模块的xticks()、yticks()
- 函数或轴域的set_xticks()、set_yticks()方法)
- 图例(可以使用matplotlib.pyplot模块的legend()函数)
- 标题(可以使用matplotlib.pyplot模块的title()函数)等图形属性,最后显示或保存绘图结果。
3、Matplotlib项目实战
项目1:绘制折线图与柱状图实战
函数hist()——用于绘制折线图
- 函数功能:表示某个数值变量随着时间的推移而形成的趋势
- 调用方法:plt.plot(x,y,color,linestyle,marker)
- 参数说明
- x:指定折线图的x轴数据;
- y:指定折线图的y轴数据;
- color 设置线的颜色
- linestyle 设置线的样式
- marker 标记样式
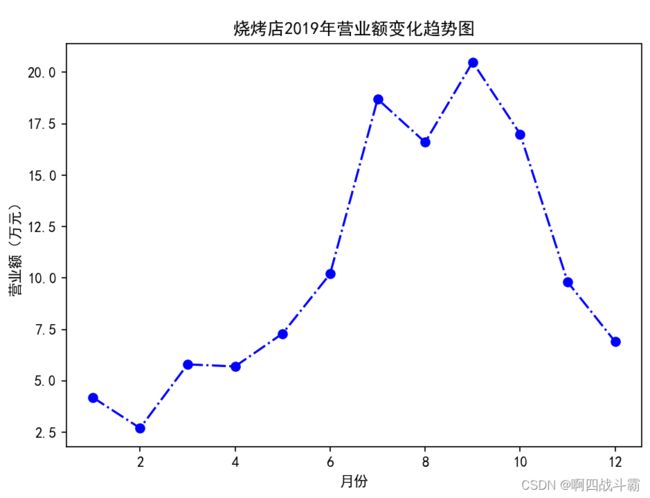
已知学校附近某烧烤店2019年每个月份的营业额。编写程序绘制折线图对该烧烤店全年营业额进行可视化,使用蓝色点划线连接每个月份的数据,并在每个月份的数据处使用圆圈标记。
import matplotlib.pyplot as plt

# 加载字体
plt.rcParams['font.sans-serif'] = ['SimHei']  # 指定默认字体
# 月份和每月营业额
month = list(range(1, 13))
money = [4.2, 2.7, 5.8, 5.7, 7.3, 10.2,
         18.7, 16.6, 20.5, 17.0, 9.8, 6.9]

plt.plot(month, money, c='b', linestyle='-.', marker='o')
plt.xlabel('月份')
plt.ylabel('营业额(万元)')
plt.title('烧烤店2019年营业额变化趋势图')

# 紧缩四周空白,扩大绘图区域可用面积
plt.tight_layout()
plt.show()
函数bar()——用于绘制柱状图
- 函数功能:在x轴上绘制定性数据的分布特征。
- 调用方法:plt.bar(x,y)
- 参数说明
- x: 标示在x轴上的定性数据的分布特征
- y: 每种定性数据类别的数量
烧烤店的数据绘制柱状图,要求可以设置每个柱的颜色、内部填充符号、描边效果和标注文本。
import matplotlib.pyplot as plt

# 加载字体
plt.rcParams['font.sans-serif'] = ['SimHei']  # 指定默认字体

# 月份和每月营业额
month = list(range(1, 13))
money = [4.2, 2.7, 5.8, 5.7, 7.3, 10.2,
         18.7, 16.6, 20.5, 17.0, 9.8, 6.9]

# 绘制每个月份的营业额
for x, y in zip(month, money):
    plt.bar(x, y,
            color='y', width=0.6,
            edgecolor='c', linestyle='-.', linewidth=1.5)
    plt.text(x - 0.3, y + 0.2, '%.1f' % y)

plt.xlabel('月份')
plt.ylabel('营业额(万元)')
plt.title('烧烤店营业额')

# 设置x轴刻度
plt.xticks(month)
# 设置y轴刻度
plt.ylim(0, 22)
plt.show()
项目2:绘制饼状图实战
函数pie()——用于绘制饼状图
- 函数功能:绘制定性数据的不同类型的百分比
- 调用方法:plt.pie(x)
- 参数说明
- x: 定性数据的不同类型的百分比
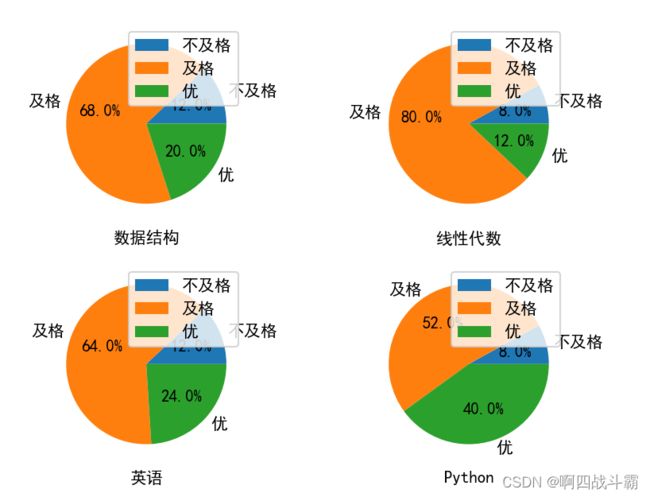
已知某班级的数据结构、线性代数、英语和Python课程考试成绩,要求绘制饼状图显示每门课的成绩中优(85分以上)、及格(60-84分)、不及格(60分以下)的占比。
from itertools import groupby
import matplotlib.pyplot as plt

# 设置图形中使用中文字体
plt.rcParams['font.sans-serif'] = ['simhei']
# 每门课程的成绩
scores = {'数据结构': [89, 70, 49, 87, 92, 84, 73, 71, 78, 81, 90, 37,
                   77, 82, 81, 79, 80, 82, 75, 90, 54, 80, 70, 68, 61],
          '线性代数': [70, 74, 80, 60, 50, 87, 68, 77, 95, 80, 79, 74,
                   69, 64, 82, 81, 78, 90, 78, 79, 72, 69, 45, 70, 70],
          '英语': [83, 87, 69, 55, 80, 89, 96, 81, 83, 90, 54, 70, 79,
                 66, 85, 82, 88, 76, 60, 80, 75, 83, 75, 70, 20],
          'Python': [90, 60, 82, 79, 88, 92, 85, 87, 89, 71, 45, 50,
                     80, 81, 87, 93, 80, 70, 68, 65, 85, 89, 80, 72, 75]}


# 自定义分组函数,在下面的groupby()函数中使用
def splitScore(score):
    if score >= 85:
        return '优'
    elif score >= 60:
        return '及格'
    else:
        return '不及格'


# 统计每门课程中优、及格、不及格的人数
# ratios的格式为{'课程名称':{'优':3, '及格':5, '不及格':1},...}
ratios = dict()
for subject, subjectScore in scores.items():
    ratios[subject] = {}
    # groupby()函数需要对原始分数进行排序才能正确分类
    for category, num in groupby(sorted(subjectScore), splitScore):
        ratios[subject][category] = len(tuple(num))

# 创建4个子图
fig, axs = plt.subplots(2, 2)
axs.shape = 4,
# 依次在4个子图中绘制每门课程的饼状图
for index, subjectData in enumerate(ratios.items()):
    # 选择子图
    plt.sca(axs[index])
    subjectName, subjectRatio = subjectData
    plt.pie(list(subjectRatio.values()),  # 每个扇形对应的数值
            labels=list(subjectRatio.keys()),  # 每个扇形的标签
            autopct='%1.1f%%')  # 百分比显示格式
    plt.xlabel(subjectName)
    plt.legend()
    plt.gca().set_aspect('equal')  # 设置纵横比相等

plt.show()
项目3:绘制散点图实战
函数scatter() ——寻找变量之间的关系
- 函数功能:散点图,寻找变量之间的关系
- 调用方法:plt.scatter(x,y,c=‘b’,label = ‘scatter figure’)
- 参数说明
- x: x轴上的数值
- y: y轴上的数值
- c: 散点图中的标记颜色
- label: 标记图形内容的标签文本
假设通过爬虫你获取到了长沙2019年4,10月份每天白天的最高气温(分别位于列表a,b),那么此时如何寻找出气温和随时间变化的某种规律
a = [11,17,16,11,12,11,12,13,10,14,8,13,12,15,14,17,18,21,16,17,30,14,15,15,15,19,21,22,22,22,23]
b = [26,26,28,19,21,17,16,19,18,20,20,19,22,23,17,20,21,20,22,15,11,15,5,13,15,10,11,13,12,13,6]
import matplotlib.pyplot as plt

# 设置图形中使用中文字体
plt.rcParams['font.sans-serif'] = ['simhei']

# 构建x,y
y_4 = [11, 17, 16, 11, 12, 11, 12, 13, 10, 14, 8, 13, 12, 15, 14, 17, 18, 21, 16, 17, 30, 14, 15, 15, 15, 19, 21, 22,
       22, 22, 23]
y_10 = [26, 26, 28, 19, 21, 17, 16, 19, 18, 20, 20, 19, 22, 23, 17, 20, 21, 20, 22, 15, 11, 15, 5, 13, 15, 10, 11, 13,
        12, 13, 6]
x_4 = range(1, 32)  # 1~31
x_10 = range(51, 82)  # 51~81

plt.scatter(x_4, y_4)
plt.scatter(x_10, y_10)

# 刻度:4月1号... 4月31号   10月1号..10月31号
x_t = list(x_4) + list(x_10)
x_l = ["4月{}号".format(i) for i in x_4]
x_l += ["10月{}号".format(i - 50) for i in x_10]
plt.xticks(x_t[::3], x_l[::3], rotation=90)
plt.tight_layout()
plt.show()
项目4:绘制气泡图实战
函数scatter()——用于绘制气泡图
- 函数功能:二维数据借助气泡大小展示三维数据
- 调用方法:plt.scatter(x,y,s=size,c=color,cmap=cmap)
- 参数说明
- x: x轴上的数值
- y: y轴上的数值
- s: 标记的大小
- c: 标记的颜色
- cmap: 标记的颜色映射表
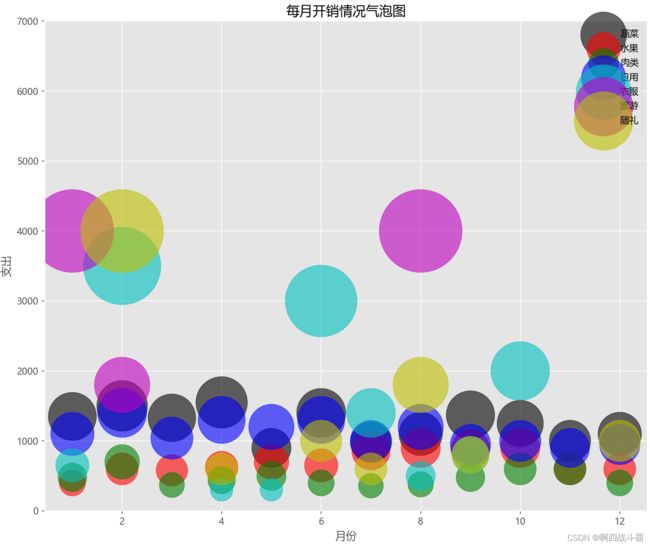
为了分析家庭开销的详细情况,也为了更好地进行家庭理财,张三对2018年全年每个月的蔬菜、水果、肉类、日用品、旅游、随礼等各项支出做了详细记录。编写程序,根据张三的家庭开销情况绘制气泡图。
import matplotlib.pyplot as plt
import pandas as pd

# 设置绘图风格
plt.style.use('ggplot')
# 处理中文乱码
plt.rcParams['font.sans-serif'] = ['Microsoft YaHei']

x = list(range(1, 13))
# 每月支出数据
data = pd.DataFrame({
    '蔬菜': [1350, 1500, 1330, 1550, 900, 1400, 980, 1100, 1370, 1250, 1000, 1100],
    '水果': [400, 600, 580, 620, 700, 650, 860, 900, 880, 900, 600, 600],
    '肉类': [480, 700, 370, 440, 500, 400, 360, 380, 480, 600, 600, 400],
    '日用': [1100, 1400, 1040, 1300, 1200, 1300, 1000, 1200, 950, 1000, 900, 950],
    '衣服': [650, 3500, 0, 300, 300, 3000, 1400, 500, 800, 2000, 0, 0],
    '旅游': [4000, 1800, 0, 0, 0, 0, 0, 4000, 0, 0, 0, 0],
    '随礼': [0, 4000, 0, 600, 0, 1000, 600, 1800, 800, 0, 0, 1000]
})
plt.figure(figsize=(10, 10))

# 1、绘制蔬菜的气泡图
plt.scatter(x=x,
            y=data['蔬菜'],
            s=2 * data['蔬菜'],
            color='k', label='蔬菜', alpha=0.6
            )
# 2、绘制水果的气泡图
plt.scatter(x=x,
            y=data['水果'],
            s=2 * data['水果'],
            color='r', label='水果', alpha=0.6
            )
# 3、绘制肉类的气泡图
plt.scatter(x=x,
            y=data['肉类'],
            s=2 * data['肉类'],
            color='g', label='肉类', alpha=0.6
            )
# 4、绘制日用的气泡图
plt.scatter(x=x,
            y=data['日用'],
            s=2 * data['日用'],
            color='b', label='日用', alpha=0.6
            )
# 5、绘制衣服的气泡图
plt.scatter(x=x,
            y=data['衣服'],
            s=2 * data['衣服'],
            color='c', label='衣服', alpha=0.6
            )
# 6、绘制旅游的气泡图
plt.scatter(x=x,
            y=data['旅游'],
            s=2 * data['旅游'],
            color='m', label='旅游', alpha=0.6
            )
# 7、绘制随礼的气泡图
plt.scatter(x=x,
            y=data['随礼'],
            s=2 * data['随礼'],
            color='y', label='随礼', alpha=0.6
            )
# 添加x轴和y轴标签
plt.xlabel('月份')
plt.ylabel('支出')
# 添加标题
plt.title('每月开销情况气泡图')
# 添加图例
plt.legend()
# 设置纵坐标的刻度范围
plt.ylim((0, 7000))
# 紧缩四周空白,扩大绘图区域可用面积
plt.tight_layout()
# 显示图形
plt.show()
4、学习分享
数据可视化是机器学习的核心,利用它有助于制定正确的策略来理解数据。数据的视觉表示帮助我们选择正确的算法。数据可视化的主要目标之一就是用图和表清晰地表达出数据,以便我们更准确、更有效地交流信息。
CSDN话题挑战赛第1期
活动详情地址:https://marketing.csdn.net/p/bb5081d88a77db8d6ef45bb7b6ef3d7f


