2.3 处理缺失数据
与本节相关的视频课程:处理缺失数据
检查缺失数据
基础知识
def foo(): pass
f = foo()
print(f)
None
type(f)
NoneType
None + 2
TypeError: unsupported operand type(s) for +: 'NoneType' and 'int'
import numpy as np
np.nan + 2
nan
type(np.nan)
float
import pandas as pd
s = pd.Series([1, 2, None, np.nan])
s
0    1.0
1    2.0
2    NaN
3    NaN
dtype: float64
s.sum()
3.0
s.isna()
0    False
1    False
2     True
3     True
dtype: bool
df = pd.DataFrame({"one":[1, 2, np.nan], "two":[np.nan, 3, 4]})
df.isna()
|
one |
two |
| 0 |
False |
True |
| 1 |
False |
False |
| 2 |
True |
False |
项目案例
hitters = pd.read_csv("/home/aistudio/data/data20507/Hitters.csv")
hitters.isna().any()
AtBat        False
Hits         False
HmRun        False
Runs         False
RBI          False
Walks        False
Years        False
CAtBat       False
CHits        False
CHmRun       False
CRuns        False
CRBI         False
CWalks       False
League       False
Division     False
PutOuts      False
Assists      False
Errors       False
Salary        True
NewLeague    False
dtype: bool
(hitters.shape[0] - hitters.count()) / hitters.shape[0]
AtBat        0.00000
Hits         0.00000
HmRun        0.00000
Runs         0.00000
RBI          0.00000
Walks        0.00000
Years        0.00000
CAtBat       0.00000
CHits        0.00000
CHmRun       0.00000
CRuns        0.00000
CRBI         0.00000
CWalks       0.00000
League       0.00000
Division     0.00000
PutOuts      0.00000
Assists      0.00000
Errors       0.00000
Salary       0.18323
NewLeague    0.00000
dtype: float64
hitters.shape
(322, 20)
hitters.count()
AtBat        322
Hits         322
HmRun        322
Runs         322
RBI          322
Walks        322
Years        322
CAtBat       322
CHits        322
CHmRun       322
CRuns        322
CRBI         322
CWalks       322
League       322
Division     322
PutOuts      322
Assists      322
Errors       322
Salary       263
NewLeague    322
dtype: int64
(df.shape[1] - df.T.count()) / df.shape[1]
0    0.5
1    0.0
2    0.5
dtype: float64
df.dropna()
df = pd.concat([df, pd.DataFrame({"one": [np.nan], "two": [np.nan], "three": [np.nan]})],
ignore_index=True, sort=False)
df
|
one |
two |
three |
| 0 |
1.0 |
NaN |
NaN |
| 1 |
2.0 |
3.0 |
NaN |
| 2 |
NaN |
4.0 |
NaN |
| 3 |
NaN |
NaN |
NaN |
df.dropna(axis=0, how='all')
|
one |
two |
three |
| 0 |
1.0 |
NaN |
NaN |
| 1 |
2.0 |
3.0 |
NaN |
| 2 |
NaN |
4.0 |
NaN |
df.dropna(thresh=2)
|
one |
two |
three |
| 1 |
2.0 |
3.0 |
NaN |
new_hitters = hitters.dropna()
new_hitters.isna().any()
AtBat        False
Hits         False
HmRun        False
Runs         False
RBI          False
Walks        False
Years        False
CAtBat       False
CHits        False
CHmRun       False
CRuns        False
CRBI         False
CWalks       False
League       False
Division     False
PutOuts      False
Assists      False
Errors       False
Salary       False
NewLeague    False
dtype: bool
动手练习
eles = pd.read_csv("/home/aistudio/data/data20507/elements.csv")
eles.isna().any()
atomic number               False
symbol                      False
name                        False
atomic mass                 False
CPK                         False
electronic configuration    False
electronegativity            True
atomic radius                True
ion radius                   True
van der Waals radius         True
IE-1                         True
EA                           True
standard state               True
bonding type                 True
melting point                True
boiling point                True
density                      True
metal                       False
year discovered             False
group                       False
period                      False
dtype: bool
(eles.shape[0] - eles.count()) / eles.shape[0]
atomic number               0.000000
symbol                      0.000000
name                        0.000000
atomic mass                 0.000000
CPK                         0.000000
electronic configuration    0.000000
electronegativity           0.177966
atomic radius               0.398305
ion radius                  0.220339
van der Waals radius        0.677966
IE-1                        0.135593
EA                          0.279661
standard state              0.161017
bonding type                0.169492
melting point               0.144068
boiling point               0.203390
density                     0.186441
metal                       0.000000
year discovered             0.000000
group                       0.000000
period                      0.000000
dtype: float64
eles_nona = eles.dropna()
eles_nona.isna().any()
atomic number               False
symbol                      False
name                        False
atomic mass                 False
CPK                         False
electronic configuration    False
electronegativity           False
atomic radius               False
ion radius                  False
van der Waals radius        False
IE-1                        False
EA                          False
standard state              False
bonding type                False
melting point               False
boiling point               False
density                     False
metal                       False
year discovered             False
group                       False
period                      False
dtype: bool
2.3.2 用指定值填补缺失数据
基础知识
df = pd.DataFrame({"one":[10, 11, 12], 'two':[np.nan, 21, 22], "three":[30, np.nan, 33]})
df
|
one |
two |
three |
| 0 |
10 |
NaN |
30.0 |
| 1 |
11 |
21.0 |
NaN |
| 2 |
12 |
22.0 |
33.0 |
df = pd.DataFrame({'ColA':[1, np.nan, np.nan, 4, 5, 6, 7], 'ColB':[1, 1, 1, 1, 2, 2, 2]})
df['ColA'].fillna(method='ffill')
0    1.0
1    1.0
2    1.0
3    4.0
4    5.0
5    6.0
6    7.0
Name: ColA, dtype: float64
df['ColA'].fillna(method='bfill')
0    1.0
1    4.0
2    4.0
3    4.0
4    5.0
5    6.0
6    7.0
Name: ColA, dtype: float64
项目案例
persons = pd.read_csv("/home/aistudio/data/data20507/Person.csv")
pdf = persons.sample(20)
pdf['Height-na'] = np.where(pdf['Height'] % 5 == 0, np.nan, pdf['Height'])
pdf
|
Gender |
Height |
Weight |
Index |
Height-na |
| 64 |
Male |
175 |
135 |
5 |
NaN |
| 225 |
Female |
155 |
144 |
5 |
NaN |
| 484 |
Female |
188 |
115 |
4 |
188.0 |
| 293 |
Female |
165 |
83 |
4 |
NaN |
| 102 |
Male |
161 |
155 |
5 |
161.0 |
| 282 |
Female |
147 |
94 |
5 |
147.0 |
| 139 |
Male |
159 |
124 |
5 |
159.0 |
| 66 |
Female |
172 |
96 |
4 |
172.0 |
| 365 |
Male |
141 |
80 |
5 |
141.0 |
| 397 |
Male |
169 |
136 |
5 |
169.0 |
| 18 |
Male |
144 |
145 |
5 |
144.0 |
| 172 |
Male |
167 |
151 |
5 |
167.0 |
| 443 |
Male |
152 |
146 |
5 |
152.0 |
| 358 |
Female |
180 |
58 |
1 |
NaN |
| 447 |
Female |
176 |
121 |
4 |
176.0 |
| 251 |
Male |
140 |
143 |
5 |
NaN |
| 360 |
Female |
193 |
61 |
1 |
193.0 |
| 346 |
Female |
191 |
68 |
2 |
191.0 |
| 5 |
Male |
189 |
104 |
3 |
189.0 |
| 294 |
Female |
168 |
143 |
5 |
168.0 |
pdf['Height-na'].fillna(pdf['Height-na'].mean(), inplace=True)
pdf
|
Gender |
Height |
Weight |
Index |
Height-na |
| 64 |
Male |
175 |
135 |
5 |
167.8 |
| 225 |
Female |
155 |
144 |
5 |
167.8 |
| 484 |
Female |
188 |
115 |
4 |
188.0 |
| 293 |
Female |
165 |
83 |
4 |
167.8 |
| 102 |
Male |
161 |
155 |
5 |
161.0 |
| 282 |
Female |
147 |
94 |
5 |
147.0 |
| 139 |
Male |
159 |
124 |
5 |
159.0 |
| 66 |
Female |
172 |
96 |
4 |
172.0 |
| 365 |
Male |
141 |
80 |
5 |
141.0 |
| 397 |
Male |
169 |
136 |
5 |
169.0 |
| 18 |
Male |
144 |
145 |
5 |
144.0 |
| 172 |
Male |
167 |
151 |
5 |
167.0 |
| 443 |
Male |
152 |
146 |
5 |
152.0 |
| 358 |
Female |
180 |
58 |
1 |
167.8 |
| 447 |
Female |
176 |
121 |
4 |
176.0 |
| 251 |
Male |
140 |
143 |
5 |
167.8 |
| 360 |
Female |
193 |
61 |
1 |
193.0 |
| 346 |
Female |
191 |
68 |
2 |
191.0 |
| 5 |
Male |
189 |
104 |
3 |
189.0 |
| 294 |
Female |
168 |
143 |
5 |
168.0 |
pdf['Height'].describe()
count     20.000000
mean     166.600000
std       16.740748
min      140.000000
25%      154.250000
50%      167.500000
75%      177.000000
max      193.000000
Name: Height, dtype: float64
pdf['Height-na'].describe()
count     20.000000
mean     167.800000
std       14.882699
min      141.000000
25%      160.500000
50%      167.800000
75%      173.000000
max      193.000000
Name: Height-na, dtype: float64
扩展研究
pdf2 = persons.sample(20)
pdf2['Height-na'] = np.where(pdf2['Height'] % 5 == 0, np.nan, pdf2['Height'])
from sklearn.impute import SimpleImputer
imp_mean = SimpleImputer(missing_values=np.nan, strategy='mean')
col_values = imp_mean.fit_transform(pdf2['Height-na'].values.reshape((-1, 1)))
col_values
array([[169.        ],
       [188.        ],
       [178.33333333],
       [178.33333333],
       [166.        ],
       [193.        ],
       [178.33333333],
       [178.        ],
       [142.        ],
       [178.33333333],
       [197.        ],
       [178.33333333],
       [186.        ],
       [171.        ],
       [178.        ],
       [176.        ],
       [183.        ],
       [184.        ],
       [188.        ],
       [176.        ]])
df = pd.DataFrame({"name": ["Google", "Huawei", "Facebook", "Alibaba"],
                   "price": [100, -1, -1, 90]
                  })
df
|
name |
price |
| 0 |
Google |
100 |
| 1 |
Huawei |
-1 |
| 2 |
Facebook |
-1 |
| 3 |
Alibaba |
90 |
imp = SimpleImputer(missing_values=-1, strategy='constant', fill_value=110)
imp.fit_transform(df['price'].values.reshape((-1, 1)))
array([[100],
       [110],
       [110],
       [ 90]])
2.3.3 根据规律填补缺失值
df = pd.DataFrame({"one":np.random.randint(1, 100, 10),
                   "two": [2, 4, 6, 8, 10, 12, 14, 16, 18, 20],
                  "three":[5, 9, 13, np.nan, 21, np.nan, 29, 33, 37, 41]})
df
|
one |
two |
three |
| 0 |
38 |
2 |
5.0 |
| 1 |
69 |
4 |
9.0 |
| 2 |
86 |
6 |
13.0 |
| 3 |
79 |
8 |
NaN |
| 4 |
73 |
10 |
21.0 |
| 5 |
90 |
12 |
NaN |
| 6 |
77 |
14 |
29.0 |
| 7 |
31 |
16 |
33.0 |
| 8 |
66 |
18 |
37.0 |
| 9 |
22 |
20 |
41.0 |
from sklearn.linear_model import LinearRegression
df_train = df.dropna()
df_test = df[df['three'].isnull()]
regr = LinearRegression()
regr.fit(df_train['two'].values.reshape(-1, 1), df_train['three'].values.reshape(-1, 1))
df_three_pred = regr.predict(df_test['two'].values.reshape(-1, 1))
df.loc[(df.three.isnull()), 'three'] = df_three_pred
df
|
one |
two |
three |
| 0 |
38 |
2 |
5.0 |
| 1 |
69 |
4 |
9.0 |
| 2 |
86 |
6 |
13.0 |
| 3 |
79 |
8 |
17.0 |
| 4 |
73 |
10 |
21.0 |
| 5 |
90 |
12 |
25.0 |
| 6 |
77 |
14 |
29.0 |
| 7 |
31 |
16 |
33.0 |
| 8 |
66 |
18 |
37.0 |
| 9 |
22 |
20 |
41.0 |
项目案例
import pandas as pd
train_data = pd.read_csv("/home/aistudio/data/data20507/train.csv")
train_data.info()
RangeIndex: 891 entries, 0 to 890
Data columns (total 12 columns):
PassengerId    891 non-null int64
Survived       891 non-null int64
Pclass         891 non-null int64
Name           891 non-null object
Sex            891 non-null object
Age            714 non-null float64
SibSp          891 non-null int64
Parch          891 non-null int64
Ticket         891 non-null object
Fare           891 non-null float64
Cabin          204 non-null object
Embarked       889 non-null object
dtypes: float64(2), int64(5), object(5)
memory usage: 83.6+ KB
train_data.isna().any()
PassengerId    False
Survived       False
Pclass         False
Name           False
Sex            False
Age             True
SibSp          False
Parch          False
Ticket         False
Fare           False
Cabin           True
Embarked        True
dtype: bool
df = train_data[['Age','Fare', 'Parch', 'SibSp', 'Pclass']]
known_age = df[df['Age'].notnull()].values
unknown_age = df[df['Age'].isnull()].values
y = known_age[:, 0]
X = known_age[:, 1:]
from sklearn.ensemble import RandomForestRegressor
rfr = RandomForestRegressor(random_state=0, n_estimators=2000, n_jobs=-1)
rfr.fit(X, y)
pred_age = rfr.predict(unknown_age[:, 1:])
pred_age.mean()
29.438010170664793
train_data.loc[(train_data.Age.isnull()), 'Age'] = pred_age
train_data.isna().any()
PassengerId    False
Survived       False
Pclass         False
Name           False
Sex            False
Age            False
SibSp          False
Parch          False
Ticket         False
Fare           False
Cabin           True
Embarked        True
dtype: bool
!mkdir /home/aistudio/external-libraries
!pip install seaborn -t /home/aistudio/external-libraries
import sys
sys.path.append('/home/aistudio/external-libraries')
%matplotlib inline
import seaborn as sns
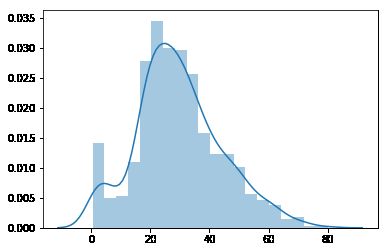
sns.distplot(y)
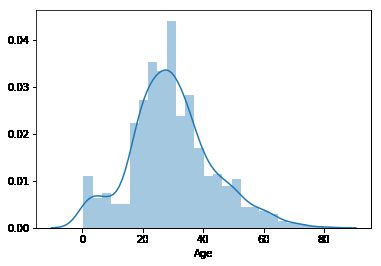
sns.distplot(train_data['Age'])
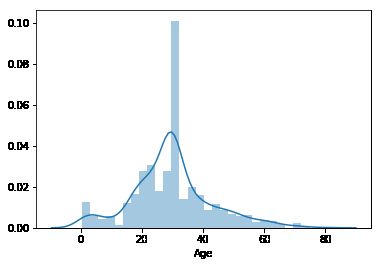
df_mean = df['Age'].fillna(df['Age'].mean())
sns.distplot(df_mean)
扩展研究
!pip install missingpy -t /home/aistudio/external-libraries
from sklearn.datasets import load_iris
import numpy as np
iris = load_iris()
X = iris.data
rng = np.random.RandomState(0)
X_missing = X.copy()
mask = np.abs(X[:, 2] - rng.normal(loc=5.5, scale=0.7, size=X.shape[0])) < 0.6
X_missing[mask, 3] = np.nan
from missingpy import KNNImputer
imputer = KNNImputer(n_neighbors=3, weights="uniform")
X_imputed = imputer.fit_transform(X_missing)
/home/aistudio/external-libraries/missingpy/utils.py:124: RuntimeWarning: invalid value encountered in sqrt
  return distances if squared else np.sqrt(distances, out=distances)
sns.distplot(X.reshape((-1, 1)))
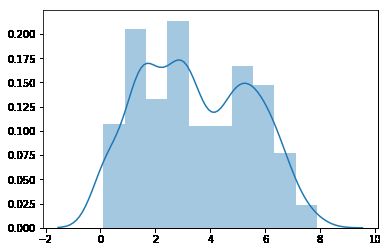
sns.distplot(X_imputed.reshape((-1, 1)))
