基于机器学习的天气数据分析与预测系统
温馨提示:源码获取请扫描文末 QQ 名片 :)
1. 项目简介
本项目利用网络爬虫技术从某天气预报网站抓取某一城市的历史天气数据,构建天气数据分析与预测系统,实现对天气状况、最高气温、最低气温、风力和风向等维度的可视化分析和横向纵向比较, 并构建机器学习聚类算法实现对天气数据的预测分析。
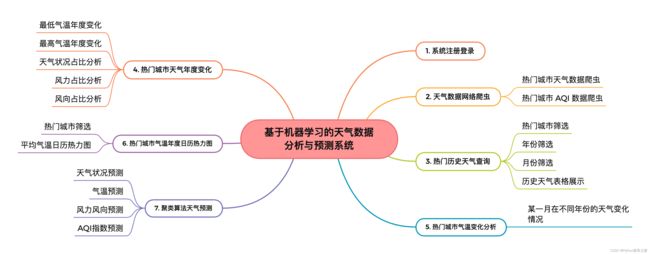
2. 功能组成
基于机器学习的天气数据分析与预测系统的功能组成如下图所示:
3. 热门城市天气数据获取
天气数据主要包括:天气状况、气温、风力风向、AQI指数等,本项目利用 python 编写网络爬虫从某天气预报网站抓取热门城市的天气数据:
years = [2016, 2017, 2018, 2019, 2020, 2021]
months = list(range(1, 13))

all_city = []
all_date = []
all_tianqi = []
all_qiwen = []
all_feng = []

year_months = []
for year in years:
    for month in months:
        year_months.append('{}{}'.format(year, month if month > 9 else '0{}'.format(month)))

for city in city_map:
    for year_month in year_months:
        print('爬取{} {} 的气温数据'.format(city, year_month))
        url = 'http://www.xxxxxx.com/lishi/{}/month/{}.html'.format(city_map[city], year_month)
        response = requests.get(url)
        response = response.text

        soup = BeautifulSoup(response, 'lxml')
        items = soup.table.find_all('tr')

        for i, item in enumerate(items):
            if i == 0:
                continue

            data = item.find_all('td')

            all_city.append(city)
            date = remove_space(data[0].text)
            tianqi = remove_space(data[1].text)
            qiwen = remove_space(data[2].text)
            feng = remove_space(data[3].text)

            all_date.append(date)
            all_tianqi.append(tianqi)
            all_qiwen.append(qiwen)
            all_feng.append(feng)

weather_df = pd.DataFrame({'城市': all_city, '日期': all_date, '天气状况': all_tianqi, '气温': all_qiwen, '风力风向': all_feng})
weather_df.to_csv('weather_data.csv', encoding='utf8', index=False)
4. 基于机器学习的天气数据分析与预测系统
4.1 系统注册登录
4.2 热门城市历史天气查询
系统提供热门城市(北京、上海、天津、重庆、贵阳、海口等30余个)按照年份和月份查询当月的天气数据:

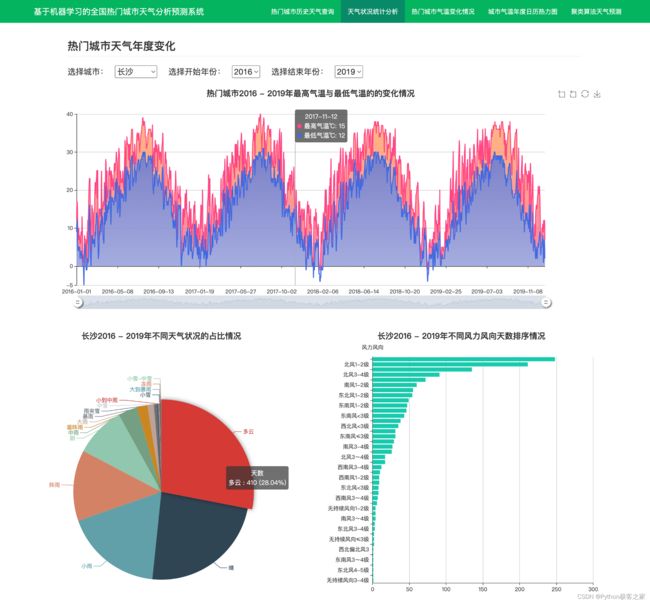
4.3 热门城市天气状况统计分析
通过对热门城市近几年的气温变化、天气状况、风力风向等指标的统计分析,可实现城市天气变化的整体把握:
4.4 热门城市气温变化情况
通过对热门城市近几年的气温变化分析,包括最低气温和最高气温,可发现气温基本呈现升高的态势,也反应出全球气候变暖问题的严重性!
def analysis_weather_year1_year2(city, start_year, end_year):
    """开始结束年间的天气变化分析"""
    start_year, end_year = int(start_year), int(end_year)
    df = weather_df[(weather_df['城市'] == city) & (weather_df['年'] >= start_year) & (weather_df['年'] <= end_year)]
    df = df.sort_values(by='日期', ascending=True)
    times = df['日期'].values.tolist()
    high_temp = df['最高气温'].values.tolist()
    low_temp = df['最低气温'].values.tolist()

    # 天气状况
    tianqi_counts = df['天气状况'].value_counts().reset_index()
    # 风力与风向
    feng_counts = df['最大风力风向'].value_counts().reset_index()
    return jsonify({'日期': times, '最高气温': high_temp, '最低气温': low_temp,
                    '天气状况': tianqi_counts['index'].values.tolist(),
                    '天气状况_个数': tianqi_counts['天气状况'].values.tolist(),
                    '风力风向': feng_counts['index'].values.tolist()[::-1],
                    '风力风向_个数': feng_counts['最大风力风向'].values.tolist()[::-1]})
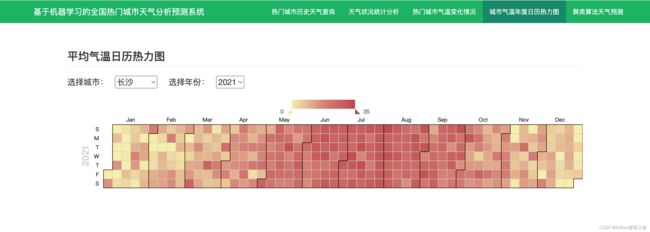
4.5 城市气温年度日历热力图
计算热门城市的某一年份每天的平均气温,利用 echarts 的 calendar 组件实现日历的气温热力图的绘制:
def get_city_calendar_data(city, year):
    df = weather_df[(weather_df['城市'] == city) | (weather_df['年'] == int(year))]
    df = df.sort_values(by='日期', ascending=True)

    max_zhibiao = max((df['最高气温'] + df['最低气温']) / 2)

    results = {}
    times = df['日期'].values.tolist()
    zhibiao_values = ((df['最高气温'] + df['最低气温']) / 2).values.tolist()
    data = {}
    for i in range(df.shape[0]):
        data[times[i]] = zhibiao_values[i]
    results[year] = data
    print(results)
    results['最大值'] = max_zhibiao
    results['年份'] = [year]
    return jsonify(results)
4.6 聚类算法天气预测
基于聚类算法实现天气状况、风力风向、AQI指数的预测,并基于AQI指数,进行出行建议。空气质量共分为6级:
- 空气质量级别为一级,空气质量状况属于优。此时,空气质量令人满意,基本无空气污染,各类人群可正常活动;
- 空气质量级别为二级,空气质量状况属于良。此时空气质量可接受,但某些污染物可能对极少数异常敏感人群健康有较弱影响,建议极少数异常敏感人群应减少户外活动;
- 空气质量级别为三级,空气质量状况属于轻度污染。此时,易感人群症状有轻度加剧,健康人群出现刺激症状。建议儿童、老年人及心脏病、呼吸系统疾病患者应减少长时间、高强度的户外锻炼;
- 空气质量级别为四级,空气质量状况属于中度污染。此时,进一步加剧易感人群症状,可能对健康人群心脏、呼吸系统有影响,建议疾病患者避免长时间、高强度的户外锻练,一般人群适量减少户外运动;
- 空气质量级别为五级,空气质量状况属于重度污染。此时,心脏病和肺病患者症状显著加剧,运动耐受力降低,健康人群普遍出现症状,建议儿童、老年人和心脏病、肺病患者应停留在室内,停止户外运动,一般人群减少户外运动;
- 空气质量级别为六级,空气质量状况属于严重污染。此时,健康人群运动耐受力降低,有明显强烈症状,提前出现某些疾病,建议儿童、老年人和病人应当留在室内,避免体力消耗,一般人群应避免户外活动。

5. 总结
本项目利用网络爬虫技术从某天气预报网站抓取某一城市的历史天气数据,构建天气数据分析与预测系统,实现对天气状况、最高气温、最低气温、风力和风向等维度的可视化分析和横向纵向比较, 并构建机器学习聚类算法实现对天气数据的预测分析。
由于篇幅有限,源码获取请扫描下方作者 QQ 名片 :)