python 使用Graphviz绘图时遇到的问题、解决方法以及Graphviz应用
Graphviz是一个开源的图形可视化软件。图形可视化是一种将结构信息表示为抽象图形和网络图的方法。它在网络、生物信息学、软件工程、数据库和网页设计、机器学习以及其他技术领域的可视化界面中有着重要的应用。
遇到的问题1:
ModuleNotFoundError: No module named 'graphviz’
原因:未安装graphviz组件
解决方法:打开cmd命令面板使用命令安装graphviz组件
pip install graphviz -i http://pypi.douban.com/simple/ --trusted-host pypi.douban.com
遇到的问题2:
graphviz.backend.ExecutableNotFound: failed to execute ['dot', '-Tpdf', '-O', '测试.gv'], make sure the Graphviz executables are on your systems' PATH
原因:未在系统中配置graphviz工具的环境变量。
Graphviz是AT&T Labs Research开发的图形绘制工具软件,不是python 工具,因此,需要独立的在系统内安装graphviz,仅在python环境内安装组件是无法使用的的。
解决方法:在官网上下载软件,安装完成后,手动配置环境变量(或者在安装时选择添加环境变量)。
官网地址: http://www.graphviz.org/download/.
安装成功的标志:打开cmd面板后输入dot -version可查看是否配置成功,若出现以下信息说明配置成功

遇到的问题3:
按照问题2解决后在python中运行仍然报错
graphviz.backend.ExecutableNotFound: failed to execute ['dot', '-Tpdf', '-O', '测试.gv'], make sure the Graphviz executables are on your systems' PATH
原因:有时候python会很笨,仍然找不到graphviz。
解决方法:在代码前面加上如下代码(又加载了一次路径,注意后面的路径是你自己的graphviz的bin目录)
import os
os.environ["PATH"] += os.pathsep + 'C:/Program Files (x86)/Graphviz/bin/'
安装过程中会遇到的问题大概就是这些了。既然已经安装好了,接下来我们来写几个代码体验一下吧。
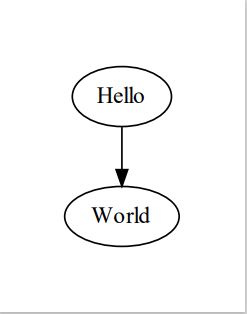
代码1:
from graphviz import Digraph
import os
os.environ["PATH"] += os.pathsep + 'D:/Program Files/Graphviz/bin/'

dot = Digraph('测试')
dot.node("1","Hello")
dot.node("2","World")
dot.edge('1','2')

dot.view()
代码2:
from sklearn.datasets import load_iris
from sklearn import tree
from sklearn.tree import export_graphviz
from six import StringIO
import pydotplus
import os
os.environ["PATH"] += os.pathsep + 'D:/Program Files/Graphviz/bin/'

dot_data = StringIO()
iris = load_iris()
clf = tree.DecisionTreeClassifier()
clf = clf.fit(iris.data, iris.target)
tree.export_graphviz(clf, out_file=dot_data)
graph = pydotplus.graph_from_dot_data(dot_data.getvalue())
graph.write_pdf("iris.pdf")
print('Visible tree plot saved as pdf.')
with open('./iris.dot', 'w', encoding='utf-8') as f:
    f = export_graphviz(clf, feature_names=iris.feature_names, out_file=f)
保存的iris.dot文件如下:
digraph Tree {
node [shape=box] ;
0 [label="petal width (cm) <= 0.8\ngini = 0.667\nsamples = 150\nvalue = [50, 50, 50]"] ;
1 [label="gini = 0.0\nsamples = 50\nvalue = [50, 0, 0]"] ;
0 -> 1 [labeldistance=2.5, labelangle=45, headlabel="True"] ;
2 [label="petal width (cm) <= 1.75\ngini = 0.5\nsamples = 100\nvalue = [0, 50, 50]"] ;
0 -> 2 [labeldistance=2.5, labelangle=-45, headlabel="False"] ;
3 [label="petal length (cm) <= 4.95\ngini = 0.168\nsamples = 54\nvalue = [0, 49, 5]"] ;
2 -> 3 ;
4 [label="petal width (cm) <= 1.65\ngini = 0.041\nsamples = 48\nvalue = [0, 47, 1]"] ;
3 -> 4 ;
5 [label="gini = 0.0\nsamples = 47\nvalue = [0, 47, 0]"] ;
4 -> 5 ;
6 [label="gini = 0.0\nsamples = 1\nvalue = [0, 0, 1]"] ;
4 -> 6 ;
7 [label="petal width (cm) <= 1.55\ngini = 0.444\nsamples = 6\nvalue = [0, 2, 4]"] ;
3 -> 7 ;
8 [label="gini = 0.0\nsamples = 3\nvalue = [0, 0, 3]"] ;
7 -> 8 ;
9 [label="sepal length (cm) <= 6.95\ngini = 0.444\nsamples = 3\nvalue = [0, 2, 1]"] ;
7 -> 9 ;
10 [label="gini = 0.0\nsamples = 2\nvalue = [0, 2, 0]"] ;
9 -> 10 ;
11 [label="gini = 0.0\nsamples = 1\nvalue = [0, 0, 1]"] ;
9 -> 11 ;
12 [label="petal length (cm) <= 4.85\ngini = 0.043\nsamples = 46\nvalue = [0, 1, 45]"] ;
2 -> 12 ;
13 [label="sepal width (cm) <= 3.1\ngini = 0.444\nsamples = 3\nvalue = [0, 1, 2]"] ;
12 -> 13 ;
14 [label="gini = 0.0\nsamples = 2\nvalue = [0, 0, 2]"] ;
13 -> 14 ;
15 [label="gini = 0.0\nsamples = 1\nvalue = [0, 1, 0]"] ;
13 -> 15 ;
16 [label="gini = 0.0\nsamples = 43\nvalue = [0, 0, 43]"] ;
12 -> 16 ;
}
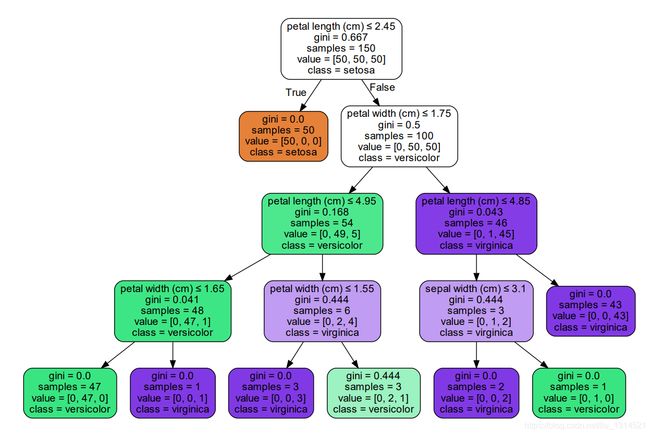
代码3:
from sklearn import datasets
from sklearn.tree import DecisionTreeClassifier

from sklearn import tree

import graphviz
import os
os.environ["PATH"] += os.pathsep + 'D:/Program Files/Graphviz/bin/'

# 仍然使用自带的iris数据
iris = datasets.load_iris()
X = iris.data
y = iris.target
# 训练模型,限制树的最大深度4
clf = DecisionTreeClassifier(max_depth=4)
# clf = DecisionTreeClassifier(max_depth=4,criterion='entropy')  #'entropy'
clf = DecisionTreeClassifier(max_depth=4, criterion='gini', splitter='best')  # 'random'
# max_feature   'none'     'log2'   'sqrt'
# 拟合模型
clf.fit(X, y)

# dtModel:决策树模型
# out_file:图形数据的输出路径
# class_names:目标属性的名称,一般用于中文化
# feature_names:特征属性的名称,一般用于种文化
# filled= True :是否使用颜色填充
# rounded=True:边框是否采用圆角边框
# special_characters: 是否有特殊字符
dot_data = tree.export_graphviz(clf, out_file=None,
                                feature_names=iris.feature_names,
                                class_names=iris.target_names,
                                filled=True, rounded=True,
                                special_characters=True)
graph = graphviz.Source(dot_data)
graph.view()
保存的Source.gv文件如下:
digraph Tree {
node [shape=box, style="filled, rounded", color="black", fontname=helvetica] ;
edge [fontname=helvetica] ;
0 [label=<petal length (cm) ≤ 2.45<br/>gini = 0.667<br/>samples = 150<br/>value = [50, 50, 50]<br/>class = setosa>, fillcolor="#ffffff"] ;
1 [label=<gini = 0.0<br/>samples = 50<br/>value = [50, 0, 0]<br/>class = setosa>, fillcolor="#e58139"] ;
0 -> 1 [labeldistance=2.5, labelangle=45, headlabel="True"] ;
2 [label=<petal width (cm) ≤ 1.75<br/>gini = 0.5<br/>samples = 100<br/>value = [0, 50, 50]<br/>class = versicolor>, fillcolor="#ffffff"] ;
0 -> 2 [labeldistance=2.5, labelangle=-45, headlabel="False"] ;
3 [label=<petal length (cm) ≤ 4.95<br/>gini = 0.168<br/>samples = 54<br/>value = [0, 49, 5]<br/>class = versicolor>, fillcolor="#4de88e"] ;
2 -> 3 ;
4 [label=<petal width (cm) ≤ 1.65<br/>gini = 0.041<br/>samples = 48<br/>value = [0, 47, 1]<br/>class = versicolor>, fillcolor="#3de684"] ;
3 -> 4 ;
5 [label=<gini = 0.0<br/>samples = 47<br/>value = [0, 47, 0]<br/>class = versicolor>, fillcolor="#39e581"] ;
4 -> 5 ;
6 [label=<gini = 0.0<br/>samples = 1<br/>value = [0, 0, 1]<br/>class = virginica>, fillcolor="#8139e5"] ;
4 -> 6 ;
7 [label=<petal width (cm) ≤ 1.55<br/>gini = 0.444<br/>samples = 6<br/>value = [0, 2, 4]<br/>class = virginica>, fillcolor="#c09cf2"] ;
3 -> 7 ;
8 [label=<gini = 0.0<br/>samples = 3<br/>value = [0, 0, 3]<br/>class = virginica>, fillcolor="#8139e5"] ;
7 -> 8 ;
9 [label=<gini = 0.444<br/>samples = 3<br/>value = [0, 2, 1]<br/>class = versicolor>, fillcolor="#9cf2c0"] ;
7 -> 9 ;
10 [label=<petal length (cm) ≤ 4.85<br/>gini = 0.043<br/>samples = 46<br/>value = [0, 1, 45]<br/>class = virginica>, fillcolor="#843de6"] ;
2 -> 10 ;
11 [label=<sepal length (cm) ≤ 5.95<br/>gini = 0.444<br/>samples = 3<br/>value = [0, 1, 2]<br/>class = virginica>, fillcolor="#c09cf2"] ;
10 -> 11 ;
12 [label=<gini = 0.0<br/>samples = 1<br/>value = [0, 1, 0]<br/>class = versicolor>, fillcolor="#39e581"] ;
11 -> 12 ;
13 [label=<gini = 0.0<br/>samples = 2<br/>value = [0, 0, 2]<br/>class = virginica>, fillcolor="#8139e5"] ;
11 -> 13 ;
14 [label=<gini = 0.0<br/>samples = 43<br/>value = [0, 0, 43]<br/>class = virginica>, fillcolor="#8139e5"] ;
10 -> 14 ;
}


