机器学习应用篇(二)——KNN
机器学习应用篇(二)——KNN
文章目录
- 机器学习应用篇(二)——KNN
-
- 一、KNN分类中k值的作用
- 二、KNN分类——鸢尾花数据集
- 三、KNN回归
- 四、马绞痛数据——KNN数据预处理+KNN分类pipeline
一、KNN分类中k值的作用
#%%KNN做分类
#库函数导入
import numpy as np
import matplotlib.pyplot as plt
from matplotlib.colors import ListedColormap
from sklearn.neighbors import KNeighborsClassifier
from sklearn import datasets
#数据导入 使用莺尾花数据集的前两维数据,便于数据可视化
iris = datasets.load_iris()
X = iris.data[:, :2]
y = iris.target
#模型训练&可视化
k_list = [1, 3, 5, 8, 10, 15]
h = .02
# 创建不同颜色的画布
cmap_light = ListedColormap(['orange', 'cyan', 'cornflowerblue'])
cmap_bold = ListedColormap(['darkorange', 'c', 'darkblue'])

plt.figure(figsize=(15,14))
# 根据不同的k值进行可视化
for ind,k in enumerate(k_list):
    clf = KNeighborsClassifier(k)
    clf.fit(X, y)
    # 画出决策边界
    x_min, x_max = X[:, 0].min() - 1, X[:, 0].max() + 1
    y_min, y_max = X[:, 1].min() - 1, X[:, 1].max() + 1
    xx, yy = np.meshgrid(np.arange(x_min, x_max, h),
                         np.arange(y_min, y_max, h))
    Z = clf.predict(np.c_[xx.ravel(), yy.ravel()])
    # 根据边界填充颜色
    Z = Z.reshape(xx.shape)

    plt.subplot(321+ind)
    plt.pcolormesh(xx, yy, Z, cmap=cmap_light)
    # 数据点可视化到画布
    plt.scatter(X[:, 0], X[:, 1], c=y, cmap=cmap_bold,
                edgecolor='k', s=20)
    plt.xlim(xx.min(), xx.max())
    plt.ylim(yy.min(), yy.max())
    plt.title("3-Class classification (k = %i)"% k)

plt.show()
#%%
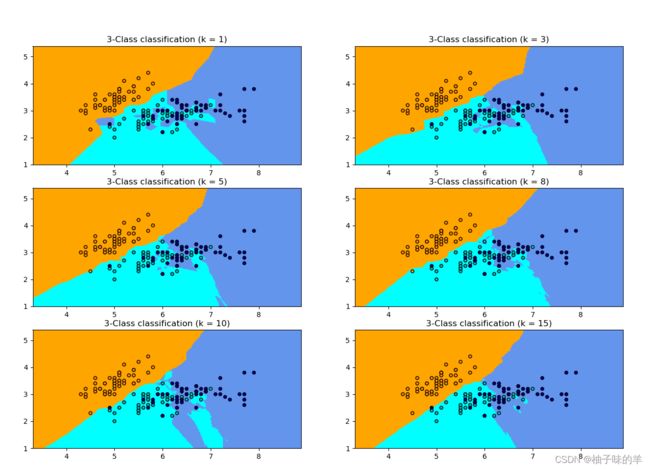
运行结果

知识点:
k值越小,相当于用较小的领域训练实例进行预测,数据局部敏感。如上图,当k=1时,蓝色区域还有青色的部分,但是当k=15时,不同的数据基本分开,此时进行预测,会直接落到对应的区域。
二、KNN分类——鸢尾花数据集
#%%鸢尾花数据集——KNN分类
import numpy as np
# 加载莺尾花数据集
from sklearn import datasets
# 导入KNN分类器
from sklearn.neighbors import KNeighborsClassifier
from sklearn.model_selection import train_test_split
# 导入莺尾花数据集
iris = datasets.load_iris()

X = iris.data
y = iris.target
# 得到训练集合和验证集合, 8: 2
X_train, X_test, y_train, y_test = train_test_split(X, y, test_size=0.2)

# 训练模型 设置k=5,使用欧氏距离 p=2, metric="minkowski"
clf = KNeighborsClassifier(n_neighbors=5, p=2, metric="minkowski")
clf.fit(X_train, y_train)
#模型预测&可视化

X_pred = clf.predict(X_test)
acc = sum(X_pred == y_test) / X_pred.shape[0]
print("预测的准确率ACC: %.3f" % acc)
三、KNN回归
#%%KNN回归
#库函数导入
import numpy as np
import matplotlib.pyplot as plt
from sklearn.neighbors import KNeighborsRegressor
#数据导入&分析
np.random.seed(0)
# 随机生成40个(0, 1)之前的数,乘以5,再进行升序
X = np.sort(5 * np.random.rand(40, 1), axis=0)
# 创建[0, 5]之间的500个数的等差数列, 作为测试数据
T = np.linspace(0, 5, 500)[:, np.newaxis]
# 使用sin函数得到y值,并拉伸到一维
y = np.sin(X).ravel()
# Add noise to targets[y值增加噪声]
y[::5] += 1 * (0.5 - np.random.rand(8))
#模型训练&预测可视化
# Fit regression model
# 设置多个k近邻进行比较
n_neighbors = [1, 3, 5, 8, 10, 40]
# 设置图片大小
plt.figure(figsize=(10,20))
for i, k in enumerate(n_neighbors):
    # 默认使用加权平均进行计算predictor
    clf = KNeighborsRegressor(n_neighbors=k, p=2, metric="minkowski")
    # 训练
    clf.fit(X, y)
    # 预测
    y_predict = clf.predict(T)
    plt.subplot(321+i)
    plt.scatter(X, y, color='red', label='data')
    plt.plot(T, y_predict, color='navy', label='prediction')
    plt.axis('tight')
    plt.legend()
    plt.title("KNeighborsRegressor (k = %i)" % (k))

plt.tight_layout()
plt.show()
运行结果

知识点:
回归(regression)通俗讲就是将离散的点统一用连续的方式描述出来。(不同的内部函数回归的结果不同)
从上图不难看出,当k=1(小)预测的结果只和最近的一个训练样本相关,从预测曲线可以看出k很小的时候容易发生过拟合现象。当k=40,预测的结果与最近的40个结果相关,在初始我们共有40个样本,此时是所有的预测值是样本的均值,发生欠拟合。一般,使用knn根据数据规模会从[3,20]之间尝试k值,选择最好的k
四、马绞痛数据——KNN数据预处理+KNN分类pipeline
data:[数据集及数据说明下载]
#%%KNN数据预处理
import numpy as np
import pandas as pd
# kNN分类器
from sklearn.neighbors import KNeighborsClassifier
# kNN数据空值填充
from sklearn.impute import KNNImputer
# 计算带有空值的欧式距离
from sklearn.metrics.pairwise import nan_euclidean_distances
# 交叉验证
from sklearn.model_selection import cross_val_score
# KFlod的函数
from sklearn.model_selection import RepeatedStratifiedKFold
from sklearn.pipeline import Pipeline
import matplotlib.pyplot as plt
from sklearn.model_selection import train_test_split
#数据导入与分析

# load dataset, 将?变成空值
input_file = './data/horse-colic.csv'
df_data = pd.read_csv(input_file, header=None, na_values='?')

# 得到训练数据和label, 第23列表示是否发生病变, 1: 表示Yes; 2: 表示No.
data = df_data.values
ix = [i for i in range(data.shape[1]) if i != 23]
#读取所有特征值
X, y = data[:, ix], data[:, 23]

# 查看所有特征的缺失值个数和缺失率
for i in range(df_data.shape[1]):
    n_miss = df_data[[i]].isnull().sum()
    perc = n_miss / df_data.shape[0] * 100
    if n_miss.values[0] > 0:
        print('>Feat: %d, Missing: %d, Missing ratio: (%.2f%%)' % (i, n_miss, perc))

# 查看总的空值个数
print('Missing before KNNImputer : %d' % sum(np.isnan(X).flatten()))
# 定义 knnimputer
imputer = KNNImputer()
# 填充数据集中的空值
imputer.fit(X)
# 转换数据集
Xtrans = imputer.transform(X)
# 打印转化后的数据集的空值
print('Missing after KNNImputer: %d' % sum(np.isnan(Xtrans).flatten()))

#基于pipeline模型训练&可视化
results = list()
strategies = [str(i) for i in [1, 2, 3, 4, 5, 6, 7, 8, 9, 10, 15, 16, 18, 20, 21]]
for s in strategies:
    # create the modeling pipeline
    pipe = Pipeline(steps=[('imputer', KNNImputer(n_neighbors=int(s))), ('model', KNeighborsClassifier())])
    # 数据多次随机划分取平均得分
    scores = []
    #随机切分20次数据
    for k in range(20):
        # 得到训练集合和验证集合, 8: 2
        X_train, X_test, y_train, y_test = train_test_split(Xtrans, y, test_size=0.2)
        pipe.fit(X_train, y_train)
        # 验证model
        score = pipe.score(X_test, y_test)
        scores.append(score)
    # 保存results
    results.append(np.array(scores))
    print('>k: %s, Acc Mean: %.3f, Std: %.3f' % (s, np.mean(scores), np.std(scores)))
# print(results)
# plot model performance for comparison
plt.boxplot(results, labels=strategies, showmeans=True)
plt.show()


