python绘图-seaborn(sns)的主题风格
画出吸引人的图形很重要。当您探索一个数据集时,为自己制作数字时,最好能够有一些看起来令人愉快的情节。视觉化也是向观众传达量化见解的核心,在这种情况下,更有必要使用能吸引注意力和吸引观众的图形。
Matplotlib是高度可定制的,但是很难知道需要调整哪些设置才能获得一个吸引人的情节。Seaborn提供了许多定制的主题和用于控制matplotlib图形外观的高级界面。
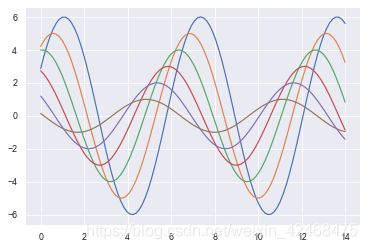
我们先来看一下什么风格都没有时候的场景:
import numpy as np
import seaborn as sns
import matplotlib.pyplot as plt
def sinplot(flip=1):
    x = np.linspace(0, 14, 100)
    for i in range(1, 7):
        plt.plot(x, np.sin(x + i * .5) * (7 - i) * flip)

#调用函数
sinplot()
out:
使用set_theme()修改主题
seaborn.set_theme(context='notebook', style='darkgrid', palette='deep', font='sans-serif', font_scale=1, color_codes=True, rc=None)
我们先来看这个函数的参数有哪些:
context:string or dict
Plotting context parameters, see plotting_context().
style:string or dict
Axes style parameters, see axes_style().
palette:string or sequence
Color palette, see color_palette().
font:string
Font family, see matplotlib font manager.
font_scale:float, optional
Separate scaling factor to independently scale the size of the font elements.
color_codes:bool
If True and palette is a seaborn palette, remap the shorthand color codes (e.g. “b”, “g”, “r”, etc.) to the colors from this palette.
rc:dict or None
Dictionary of rc parameter mappings to override the above.
后文会介绍 style context rc 这三个参数。
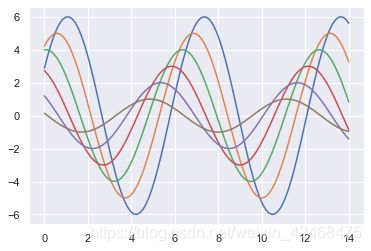
我们可以使用set_theme()修改全局默认的主题风格:
默认的是 darkgrid 的风格
sns.set_theme(style="darkgrid")
sinplot()
out:
Seaborn将matplotlib参数分成两个独立的组。第一组设定了图像的style,第二组对 figure 的各种 elements 进行sacle,便于融入不同的背景中。
操作这些参数的接口是两对函数。要控制style,可以使用axes_style()和set_style()函数。要控制scale,可以使用**plotting_context()和set_context()**函数。在这两种情况下,第一个函数返回一个参数字典,第二个函数设置matplotlib的默认值。
使用sns.set_style()调整style
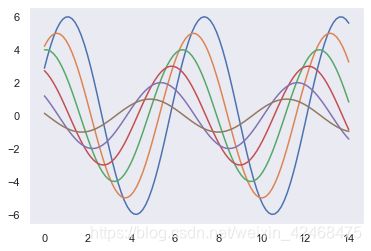
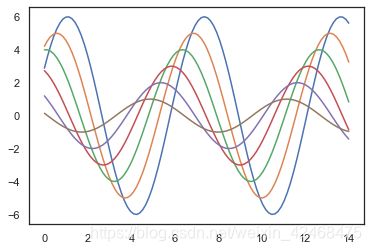
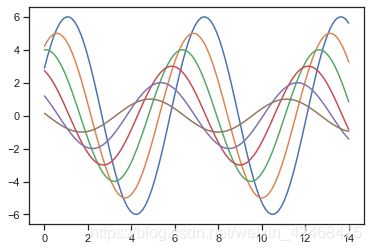
有五个预设的海运主题:darkgrid, whitegrid, dark, white, and ticks。它们分别适用于不同的应用程序和个人偏好。默认的主题是darkgrid。正如上面所提到的,网格帮助图作为定量信息的查找表,而whitegrid有助于防止网格与表示数据的线竞争。white egrid的主题类似,但它更适合重数据元素的情节。我们来看看几种不同的style呈现;
darkgrid
whitegrid
dark
white
ticks
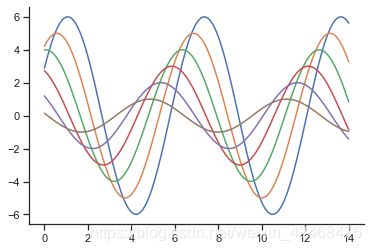
去除axes spines(坐标脊)
对 white and ticks style有用
sns.despine()
sinplot()
sns.despine()
使用sns.axes_style()调整style
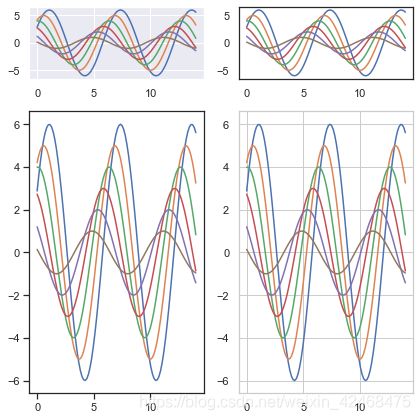
Although it’s easy to switch back and forth, you can also use the axes_style() function in a with statement to temporarily set plot parameters. This also allows you to make figures with differently-styled axes:
import matplotlib.pyplot as plt
import numpy as np
from matplotlib import gridspec

f = plt.figure(figsize=(6, 6))

gs = gridspec.GridSpec(4, 4)

with sns.axes_style("darkgrid"):
    ax = f.add_subplot(gs[0, 0])
    sinplot()

with sns.axes_style("white"):
    ax = f.add_subplot(gs[0, 1])
    sinplot()

with sns.axes_style("ticks"):
    ax = f.add_subplot(gs[1:4, 0])
    sinplot()

with sns.axes_style("whitegrid"):
    ax = f.add_subplot(gs[1:4, 1])
    sinplot()

f.tight_layout()
out:
关于GridSpec的用法请参考:GridSpec的用法
重载seaborn styles的elements
If you want to customize the seaborn styles, you can pass a dictionary of parameters to the rc argument of axes_style() and set_style(). Note that you can only override the parameters that are part of the style definition through this method.
用sns.axes_style()查看当前配置的参数
sns.axes_style()
out:
{‘axes.facecolor’: ‘white’,
‘axes.edgecolor’: ‘.15’,
‘axes.grid’: True,
‘axes.axisbelow’: True,
‘axes.labelcolor’: ‘.15’,
‘figure.facecolor’: ‘white’,
‘grid.color’: ‘.8’,
‘grid.linestyle’: ‘-’,
‘text.color’: ‘.15’,
‘xtick.color’: ‘.15’,
‘ytick.color’: ‘.15’,
‘xtick.direction’: ‘out’,
‘ytick.direction’: ‘out’,
‘lines.solid_capstyle’: ‘round’,
‘patch.edgecolor’: ‘w’,
‘patch.force_edgecolor’: True,
‘image.cmap’: ‘rocket’,
‘font.family’: [‘sans-serif’],
‘font.sans-serif’: [‘Arial’,
‘DejaVu Sans’,
‘Liberation Sans’,
‘Bitstream Vera Sans’,
‘sans-serif’],
‘xtick.bottom’: True,
‘xtick.top’: False,
‘ytick.left’: True,
‘ytick.right’: False,
‘axes.spines.left’: True,
‘axes.spines.bottom’: True,
‘axes.spines.right’: True,
‘axes.spines.top’: True}
You can then set different versions of these parameters:
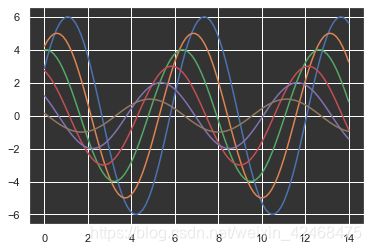
# 第一个参数是整体风格,第二个参数是具体某个element的参数
sns.set_style("darkgrid", {"axes.facecolor": ".2"})
sinplot()
Scaling plot elements
A separate set of parameters control the scale of plot elements, which should let you use the same code to make plots that are suited for use in settings where larger or smaller plots are appropriate.
First let’s reset the default parameters by calling set_theme():
sns.set_theme()
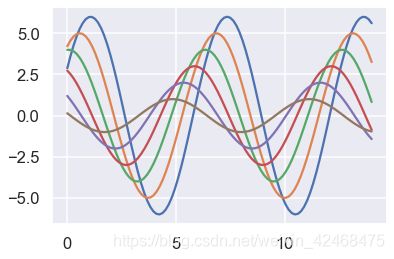
The four preset contexts, in order of relative size, are paper, notebook, talk, and poster. The notebook style is the default, and was used in the plots above.
修改元素大小
尝试使用上述四种 context的size:
sns.set_context("paper")
sinplot()
sns.set_context("talk")
sinplot()
sns.set_context("poster")
sinplot()
out:
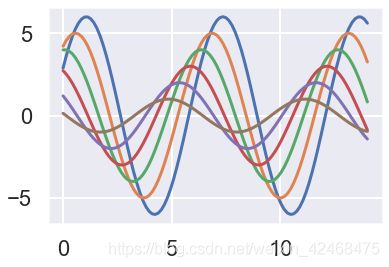
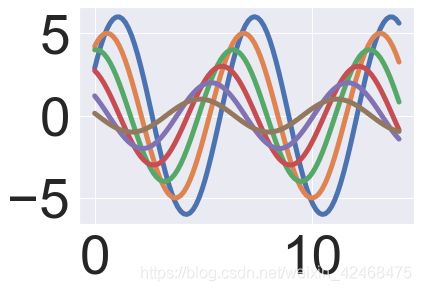
还可以在 set_context() 指定字体大小和线宽:
sns.set_context("notebook", font_scale=5.0, rc={"lines.linewidth": 5.0})
sinplot()
自定义element的size和width
需要用到这个函数:seaborn.plotting_context(context=None, font_scale=1, rc=None)
先介绍一下它的参数:
返回:Return a parameter dict to scale elements of the figure.
1.context:dict, None, or one of {paper, notebook, talk, poster} 就是四选一,然后自己微调
A dictionary of parameters or the name of a preconfigured set.
2.font_scale:float, optional
Separate scaling factor to independently scale the size of the font elements.
3.rc:dict, optional 这个参数是最重要的
Parameter mappings to override the values in the preset seaborn context dictionaries. This only updates parameters that are considered part of the context definition.
使用方法:
1.随便查看一种context:
c = sns.plotting_context("poster")
print(c)
out:
{‘axes.linewidth’: 2.5,
‘grid.linewidth’: 2,
‘lines.linewidth’: 2,
‘lines.markersize’: 12,
‘patch.linewidth’: 2,
‘xtick.major.width’: 2.5,
‘ytick.major.width’: 2.5,
‘xtick.minor.width’: 2,
‘ytick.minor.width’: 2,
‘xtick.major.size’: 12,
‘ytick.major.size’: 12,
‘xtick.minor.size’: 8,
‘ytick.minor.size’: 8,
‘font.size’: 24,
‘axes.labelsize’: 24,
‘axes.titlesize’: 24,
‘xtick.labelsize’: 22,
‘ytick.labelsize’: 22,
‘legend.fontsize’: 22,
‘legend.title_fontsize’: 24}
以上列出的参数是可以自行调整的,如果我们想要修改默认context配置,这样改:
# 建议在原有方案的基础上改哦
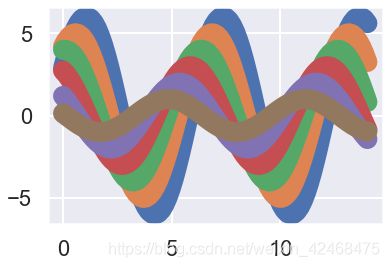
c = sns.plotting_context("poster", rc={'lines.linewidth': 20})
sns.set_context(c)
sinplot())
参考:
GridSpec用法


