机器学习:sklearn实现心脏病预测
数据集:链接:https://pan.baidu.com/s/1KVRkkRp-E-W0tS4Q9qU7Ag 提取码:a9wl
补充:快捷显示比较图操作
离散变量
ax1 = plt.subplot(121)
ax2 = plt.subplot(122)
death_df.thal.value_counts().sort_index().plot(kind="bar",ax = ax1)
living_df.thal.value_counts().sort_index().plot(kind="bar",ax = ax2)
连续变量
plt.figure(figsize=(20, 10))
ax1 = plt.subplot(221)
ax2 = plt.subplot(222)


ejectionFraction_groups=pd.cut(living_df["ejectionFraction"],bins=[0,0.35,0.5,0.7,0.8])
ejectionFraction_target_df = pd.concat([ejectionFraction_groups,living_df.target],axis=1)
sns.countplot(x="ejectionFraction",hue='target',data=ejectionFraction_target_df,ax=ax1)

ejectionFraction_groups=pd.cut(death_df["ejectionFraction"],bins=[0,0.35,0.5,0.7,0.8])
ejectionFraction_target_df = pd.concat([ejectionFraction_groups,death_df.target],axis=1)
sns.countplot(x="ejectionFraction",hue='target',data=ejectionFraction_target_df,ax=ax2)
- 56.心脏病预测-数据集介绍
- 57.心脏病预测-性别与患病分析
- 58.1.心脏病预测-特征相关性分析
- 58.心脏病预测-特征预处理
- 59.心脏病预测-K近邻预测
- 60.心脏病预测-精准率召回率以及ROC曲线
- 61.心脏病预测-决策树算法评估
- 62.心脏病预测-随机森林算法评估
- 63.心脏病预测-逻辑回归算法评估
- 64.心脏病预测-SGD分类算法评估
- 65.心脏病预测-特征重要性分析
心脏病预测-数据集介绍
import pandas as pd
import numpy as np
import matplotlib.pyplot as plt
import seaborn as sns

plt.rcParams['font.sans-serif'] = ['SimHei']
heart_df = pd.read_csv("./data/heart.csv")
heart_df.head()
# heart_df.info()
age - 年龄
sex - (1 = male(男性); 0 = (女性))
cp - chest pain type(胸部疼痛类型)(1:典型的心绞痛-typical,2:非典型心绞痛-atypical,3:没有心绞痛-non-anginal,4:无症状-asymptomatic)
trestbps - 静息血压 (in mm Hg on admission to the hospital)
chol - 胆固醇 in mg/dl
fbs - (空腹血糖 > 120 mg/dl) (1 = true; 0 = false)
restecg - 静息心电图测量(0:普通,1:ST-T波异常,2:可能左心室肥大)
thalach - 最高心跳率
exang - 运动诱发心绞痛 (1 = yes; 0 = no)
oldpeak - 运动相对于休息引起的ST抑制
slope - 运动ST段的峰值斜率(1:上坡-upsloping,2:平的-flat,3:下坡-downsloping)
ca - 主要血管数目(0-4)
thal - 一种叫做地中海贫血的血液疾病(3 = normal; 6 = 固定的缺陷-fixed defect; 7 = 可逆的缺陷-reversable defect)
target - 是否患病 (1=yes, 0=no)
心脏病预测-性别与患病分析
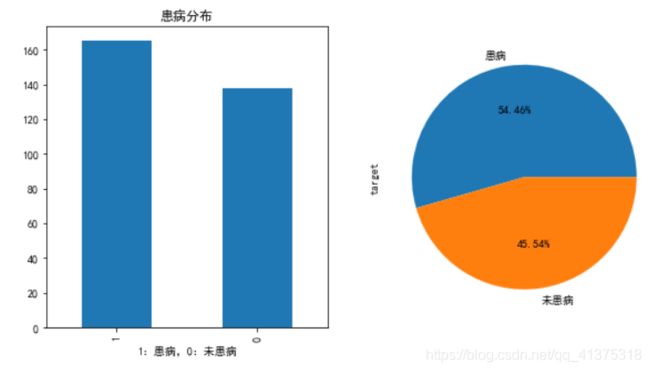
# 患病的分布情况
fig,axes = plt.subplots(1,2,figsize=(10,5))
ax = heart_df.target.value_counts().plot(kind="bar",ax=axes[0])
ax.set_title("患病分布")
ax.set_xlabel("1:患病,0:未患病")

heart_df.target.value_counts().plot(kind="pie",autopct="%.2f%%",labels=['患病','未患病'],ax=axes[1])
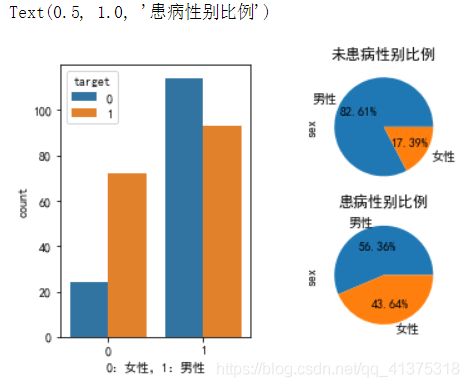
# 性别和患病的分布
ax1 = plt.subplot(121)
ax = sns.countplot(x="sex",hue='target',data=heart_df,ax=ax1)
ax.set_xlabel("0:女性,1:男性")

ax2 = plt.subplot(222)
heart_df[heart_df['target'] == 0].sex.value_counts().plot(kind="pie",autopct="%.2f%%",labels=['男性','女性'],ax=ax2)
ax2.set_title("未患病性别比例")

ax2 = plt.subplot(224)
heart_df[heart_df['target'] == 1].sex.value_counts().plot(kind="pie",autopct="%.2f%%",labels=['男性','女性'],ax=ax2)
ax2.set_title("患病性别比例")
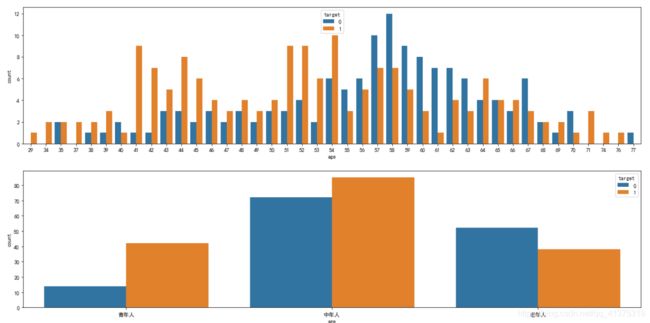
fig,axes = plt.subplots(2,1,figsize=(20,10))
sns.countplot(x="age",hue="target",data=heart_df,ax=axes[0])

# 0-45:青年人,45-59:中年人,60-100:老年人
age_type = pd.cut(heart_df.age,bins=[0,45,60,100],include_lowest=True,right=False,labels=['青年人','中年人','老年人'])
age_target_df = pd.concat([age_type,heart_df.target],axis=1)
sns.countplot(x="age",hue='target',data=age_target_df)
心脏病预测-特征相关性分析
# 统一看下所有特征的分布情况
fig,axes = plt.subplots(7,2,figsize=(10,20))
for x in range(0,14):
    plt.subplot(7,2,x+1)
    sns.distplot(heart_df.iloc[:,x],kde=True)

plt.tight_layout()
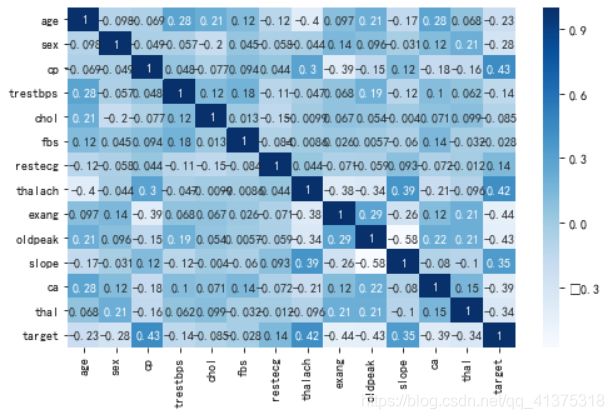
plt.figure(figsize=(8,5))
sns.heatmap(heart_df.corr(),cmap="Blues",annot=True)
心脏病预测-特征预处理
# 数据预处理
features = heart_df.drop(columns=['target'])
targets = heart_df['target']
# 将离散型数据,从普通的0,1,2这些,转换成真正的字符串表示

# sex
features.loc[features['sex']==0,'sex'] = 'female'
features.loc[features['sex']==1,'sex'] = 'male'

# cp
features.loc[features['cp'] == 1,'cp'] = 'typical'
features.loc[features['cp'] == 2,'cp'] = 'atypical'
features.loc[features['cp'] == 3,'cp'] = 'non-anginal'
features.loc[features['cp'] == 4,'cp'] = 'asymptomatic'

# fbs
features.loc[features['fbs'] == 1,'fbs'] = 'true'
features.loc[features['fbs'] == 0,'fbs'] = 'false'

# exang
features.loc[features['exang'] == 1,'exang'] = 'true'
features.loc[features['exang'] == 0,'exang'] = 'false'

# slope
features.loc[features['slope'] == 1,'slope'] = 'true'
features.loc[features['slope'] == 2,'slope'] = 'true'
features.loc[features['slope'] == 3,'slope'] = 'true'

# thal
features.loc[features['thal'] == 3,'thal'] = 'normal'
features.loc[features['thal'] == 3,'thal'] = 'fixed'
features.loc[features['thal'] == 3,'thal'] = 'reversable'

# restecg
# 0:普通,1:ST-T波异常,2:可能左心室肥大
features.loc[features['restecg'] == 0,'restecg'] = 'normal'
features.loc[features['restecg'] == 1,'restecg'] = 'ST-T abnormal'
features.loc[features['restecg'] == 2,'restecg'] = 'Left ventricular hypertrophy'

# ca
features['ca'].astype("object")

# thal
features.thal.astype("object")

features.head()
from sklearn.preprocessing import StandardScaler
from sklearn.model_selection import train_test_split

features = pd.get_dummies(features)
features_temp = StandardScaler().fit_transform(features)
# features_temp = StandardScaler().fit_transform(pd.get_dummies(features))

X_train,X_test,y_train,y_test = train_test_split(features_temp,targets,test_size=0.25)
K近邻
决策树
随机森林
逻辑回归
SGD分类
心脏病预测-K近邻预测
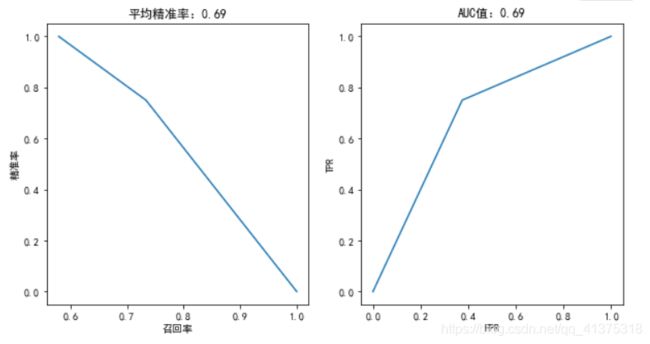
from sklearn.neighbors import KNeighborsClassifier
from sklearn.model_selection import cross_val_score
from sklearn.metrics import precision_score,recall_score,f1_score
from sklearn.metrics import precision_recall_curve,roc_curve,average_precision_score,auc
# https://www.jianshu.com/p/c61ae11cc5f6
def plotting(estimator,y_test):
    fig,axes = plt.subplots(1,2,figsize=(10,5))
    y_predict_proba = estimator.predict_proba(X_test)
    precisions,recalls,thretholds = precision_recall_curve(y_test,y_predict_proba[:,1])
    axes[0].plot(precisions,recalls)
    axes[0].set_title("平均精准率:%.2f"%average_precision_score(y_test,y_predict_proba[:,1]))
    axes[0].set_xlabel("召回率")
    axes[0].set_ylabel("精准率")

    fpr,tpr,thretholds = roc_curve(y_test,y_predict_proba[:,1])
    axes[1].plot(fpr,tpr)
    axes[1].set_title("AUC值:%.2f"%auc(fpr,tpr))
    axes[1].set_xlabel("FPR")
    axes[1].set_ylabel("TPR")
# 1. K近邻
knn = KNeighborsClassifier(n_neighbors=5)
scores = cross_val_score(knn,features_temp,targets,cv=5)
print("准确率:",scores.mean())

knn.fit(X_train,y_train)

y_predict = knn.predict(X_test)
# 精准率
print("精准率:",precision_score(y_test,y_predict))
# 召回率
print("召回率:",recall_score(y_test,y_predict))
# F1-Score
print("F1得分:",f1_score(y_test,y_predict))

plotting(knn,y_test)
心脏病预测-精准率召回率以及ROC曲线
心脏病预测-决策树算法评估
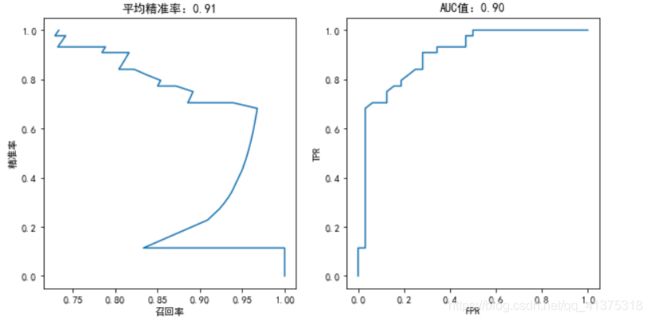
# 决策树
from sklearn.tree import DecisionTreeClassifier
tree = DecisionTreeClassifier(max_depth=10)
tree.fit(X_train,y_train)

plotting(tree,y_test)
心脏病预测-随机森林算法评估
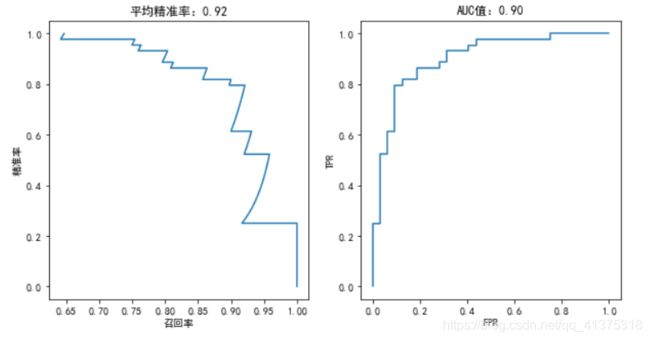
# 随机森林
from sklearn.ensemble import RandomForestClassifier
rf = RandomForestClassifier(n_estimators=100)
rf.fit(X_train,y_train)
plotting(rf,y_test)
心脏病预测-逻辑回归算法评估
# 逻辑回归
from sklearn.linear_model import LogisticRegression
logic = LogisticRegression(tol=1e-10)
logic.fit(X_train,y_train)
plotting(logic,y_test)
心脏病预测-SGD分类算法评估
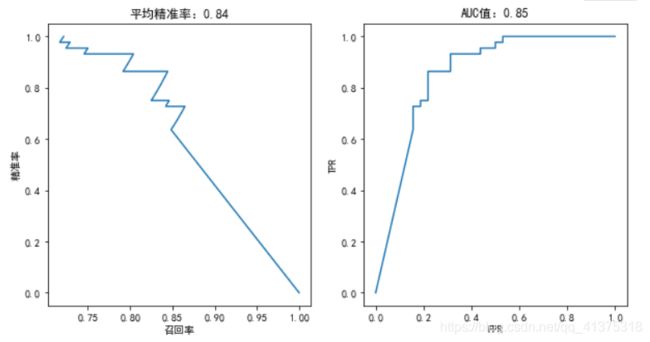
# SGD分类
from sklearn.linear_model import SGDClassifier
sgd = SGDClassifier(loss="log")
sgd.fit(X_train,y_train)
plotting(sgd,y_test)
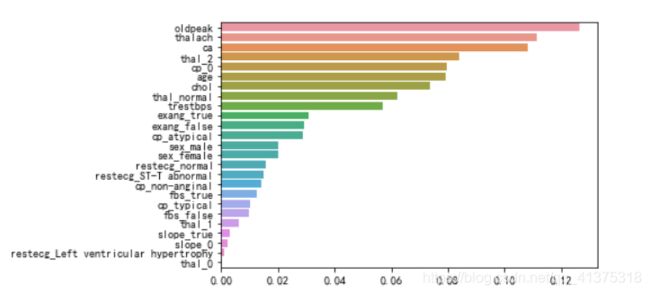
心脏病预测-特征重要性分析
importances = pd.Series(data=rf.feature_importances_,index=features.columns).sort_values(ascending=False)
sns.barplot(y=importances.index,x=importances.values,orient='h')

