echarts:3、折线图
基础折线图
<template>
	<div class="index">
		<div ref="main" class="main">div>
	div>
template>

<script>
	import * as echarts from 'echarts';
	export default {
		data() {
			return {
				option: {}
			}
		},
		mounted() {
			this.option = {
				title: {
					text: '我是标题',
					subtext: '标题下的简介',
					left: 'center'
				},
				tooltip: {
					trigger: 'axis'
				},
				xAxis: {
					type: 'category',
					data: ['周一', '周二', '周三', '周四', '周五', '周六', '周日']
				},
				yAxis: {
					type: 'value'
				},
				series: [{
					data: [150, 230, 224, 218, 135, 147, 260],
					type: 'line'
				}]

			};
			var myChart = echarts.init(this.$refs.main);
			this.option && myChart.setOption(this.option);
			window.addEventListener('resize', myChart.resize);
		},
		methods: {}
	}
script>

<style scoped lang="less">
	.index {
		.main {
			height: 600px;
			border: 1px solid red;
		}
	}
style>

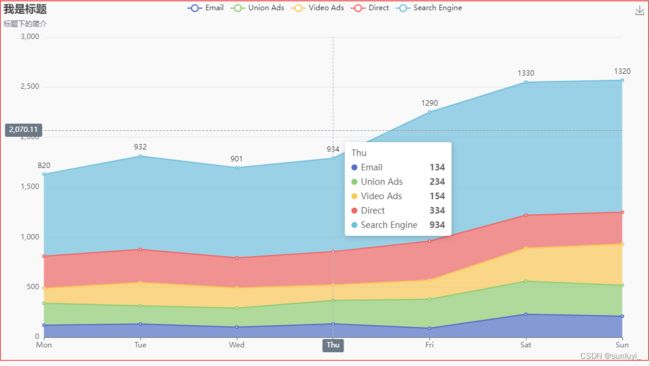
多条折线,面积堆叠图
<template>
	<div class="index">
		<div ref="main" class="main">div>
	div>
template>

<script>
	import * as echarts from 'echarts';
	export default {
		data() {
			return {
				option: {}
			}
		},
		mounted() {
			this.option = {
				title: {
					text: '我是标题',
					subtext: '标题下的简介',
					left: 'left'
				},
				tooltip: {
					trigger: 'axis',
					axisPointer: {
						type: 'cross',
						label: {
							backgroundColor: '#6a7985'
						}
					}
				},
				legend: {
					data: ['Email', 'Union Ads', 'Video Ads', 'Direct', 'Search Engine']
				},
				toolbox: {
					feature: {
						saveAsImage: {}
					}
				},
				grid: {
					left: '3%',
					right: '4%',
					bottom: '3%',
					containLabel: true
				},
				xAxis: [{
					type: 'category',
					boundaryGap: false,
					data: ['Mon', 'Tue', 'Wed', 'Thu', 'Fri', 'Sat', 'Sun']
				}],
				yAxis: [{
					type: 'value'
				}],
				series: [{
						name: 'Email',
						type: 'line',
						stack: 'Total',
						areaStyle: {},
						emphasis: {
							focus: 'series'
						},
						data: [120, 132, 101, 134, 90, 230, 210]
					},
					{
						name: 'Union Ads',
						type: 'line',
						stack: 'Total',
						areaStyle: {},
						emphasis: {
							focus: 'series'
						},
						data: [220, 182, 191, 234, 290, 330, 310]
					},
					{
						name: 'Video Ads',
						type: 'line',
						stack: 'Total',
						areaStyle: {},
						emphasis: {
							focus: 'series'
						},
						data: [150, 232, 201, 154, 190, 330, 410]
					},
					{
						name: 'Direct',
						type: 'line',
						stack: 'Total',
						areaStyle: {},
						emphasis: {
							focus: 'series'
						},
						data: [320, 332, 301, 334, 390, 330, 320]
					},
					{
						name: 'Search Engine',
						type: 'line',
						stack: 'Total',
						label: {
							show: true,
							position: 'top'
						},
						areaStyle: {},
						emphasis: {
							focus: 'series'
						},
						data: [820, 932, 901, 934, 1290, 1330, 1320]
					}
				]

			};
			var myChart = echarts.init(this.$refs.main);
			this.option && myChart.setOption(this.option);
			window.addEventListener('resize', myChart.resize);
		},
		methods: {}
	}
script>

<style scoped lang="less">
	.index {
		.main {
			height: 600px;
			border: 1px solid red;
		}
	}
style>