【数字图像处理】实验二 图像增强(MATLAB实现)
目录
一、实验意义及目的
二、实验内容
三、Matlab 相关函数介绍
四、算法原理
五、参考代码及扩展代码流程图
(1)参考代码流程图
(2)扩展代码流程图
六、参考代码
七、实验要求
(1)对以上处理变换参数,查看处理效果;
(2)更改伪彩色增强方法为热金属编码或彩虹编码伪彩色处理
(3)设计不同的平滑滤波、锐化滤波方法,查看处理效果
(4)自行设计方法,实现对彩色图像增强处理。(Python、opencv实现)
一、实验意义及目的
二、实验内容
三、Matlab 相关函数介绍
四、算法原理
图像增强是一种基本的图像处理技术,主要是为了改善图像的质量以及增强感兴趣的部分,改善图像的视觉效果或者使图像变得更加有利于计算机处理。相关的图像增强技术有针对单个像素点的点运算,也有针对像素局部领域的模板运算,根据模板运算的具体功能还可以分为图像平滑、图像锐化等。
灰度级变换就是借助于变换函数将输入的像素灰度值映射成一个新的输出值。直方图修正法的基本原理就是通过构造灰度级变换函数来改造原图像的直方图,使变换后的图像的直方图达到一定要求。而基于照度—反射模型的图像增强,通常将自然景象图像拆解成照明函数于反射函数的乘积。其算法原理,通常会借助于对数变换,将乘积转换为两个分量相加,设计函数,对高频与低频成分产生不同影响以达到图像增强效果。伪彩色增强则是一种灰度到彩色的映射技术,其目的是把灰度图像的不同灰度级按照线性或非线性映射成不同的颜色,以提高图像内容的可辨识度,达到增强的效。
图像平滑,通常把抑制或者消除图像中存在的噪声而改善图像质量的过程称为土象的平滑。图像平滑方法大致分为两大类:空域法和频域法。空域法主要借助模板运算,在像素点领域内,利用噪声像素点特性进行滤波;频域法是指对图像进行正交变换,利用噪声对应高频信息的特点进行滤波。
图像锐化,其目的在于加强图像中景物的边缘和轮廓,突出图像中的细节或增强被模糊了的细节。图像的边缘主要有三种类型:细线型、突变型、渐变型。通过分析边缘变化曲线 和其一二阶微分曲线,即可知边缘
五、参考代码及扩展代码流程图
(1)参考代码流程图
(2)扩展代码流程图
六、参考代码
Image1=im2double(imread('lotus.bmp'));
gray=rgb2gray(Image1);
imhist(gray);
[h,w]=size(gray);
NewImage1=zeros(h,w);
a=80/256; b=180/256; c=30/256; d=220/256;
for x=1:w
 for y=1:h
if gray(y,x)七、实验要求
(1)对以上处理变换参数,查看处理效果;
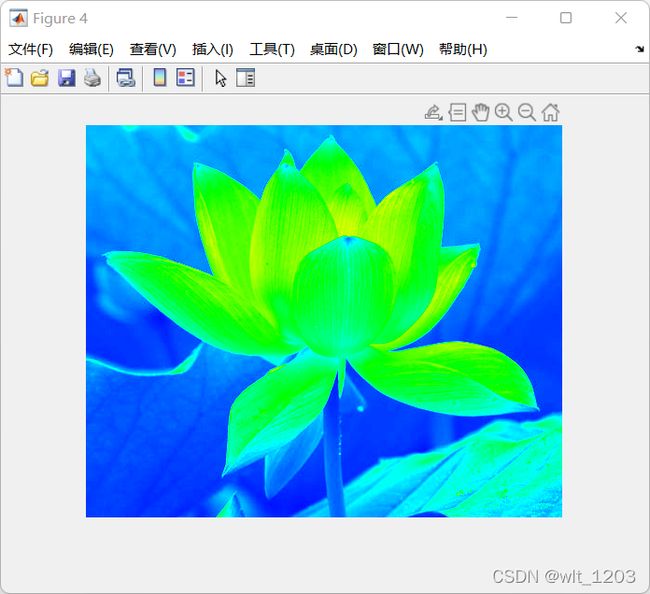
(2)更改伪彩色增强方法为热金属编码或彩虹编码
伪彩色处理
伪彩色增强:把一幅黑白域图像的不同灰度级映射为一幅彩色图像的技术手段。
伪彩色增强有很多种方法,而下面的增强方法则是使用的空间域灰度级-彩色变换法。
空间域灰度级-彩色变换法:可以将灰度图像变为具有多种颜色渐变的连续彩色图像,变换后的图像视觉效果较好,主要色相是将灰度图像f(x,y)送入具有不同变换性质的红、绿、蓝3个变换器,相对应的产生3个不同的输入fR(x,y),fG(x,y),fB(x,y)将它们对应地作为彩色图像的红绿蓝三个色彩分量合成一副彩色图像。
彩虹编码和热金属编码是其中的两种变化函数。
热金属编码
Image1=imread('lotus.bmp');

%转换为灰度
gray=rgb2gray(Image1);
[h,w]=size(gray);
%新图像的矩阵
NewImage4=zeros(h,w,3);
for x=1:h
    for y=1:w
        if gray(x,y)<64
        NewImage4(x,y,1)=0;
        elseif gray(x,y)<128
        NewImage4(x,y,1)=255*(gray(x,y)-64)/64;
        else
        NewImage4(x,y,1)=255;
        end
    end
end
for x=1:h
    for y=1:w
        if gray(x,y)<128
        NewImage4(x,y,2)=0;
        elseif gray(x,y)<192
        NewImage4(x,y,2)=255*(gray(x,y)-128)/64;
        else
        NewImage4(x,y,2)=255;
        end
    end
end
for x=1:h
    for y=1:w
        if gray(x,y)<64
        NewImage4(x,y,3)=255*gray(x,y)/64;
        elseif gray(x,y)<96
        NewImage4(x,y,3)=255;
        elseif gray(x,y)<128
        NewImage4(x,y,3)=255*(128-gray(x,y))/32;
        elseif gray(x,y)<192
        NewImage4(x,y,3)=0;
        else
        NewImage4(x,y,3)=255*(gray(x,y)-192)/64;
        end
    end
end
imshow(NewImage4),title('热金属编码')
彩虹编码
Image1=imread('lotus.bmp');

%转换为灰度
gray=rgb2gray(Image1);
[h,w]=size(gray);
%新图像的矩阵
NewImage3=zeros(h,w,3);
for x=1:h
    for y=1:w
        if gray(x,y)<96
        NewImage3(x,y,1)=0;
        elseif gray(x,y)<128
        NewImage3(x,y,1)=255*(gray(x,y)-96)/32;
        else
        NewImage3(x,y,1)=255;
        end
    end
end
for x=1:h
    for y=1:w
        if gray(x,y)<32
        NewImage3(x,y,2)=0;
        elseif gray(x,y)<64
        NewImage3(x,y,2)=255*(gray(x,y)-32)/32;
        elseif gray(x,y)<128
        NewImage3(x,y,2)=255;
        elseif gray(x,y)<192
        NewImage3(x,y,2)=255*(192-gray(x,y))/64;
        else
        NewImage3(x,y,2)=255*(gray(x,y)-192)/64;
        end
    end
end
for x=1:h
    for y=1:w
        if gray(x,y)<32
        NewImage3(x,y,3)=255*gray(x,y)/32;
        elseif gray(x,y)<64
        NewImage3(x,y,3)=255;
        elseif gray(x,y)<96
        NewImage3(x,y,3)=255*(96-gray(x,y))/32;
        elseif gray(x,y)<192
        NewImage3(x,y,3)=0;
        else
        NewImage3(x,y,3)=255*(gray(x,y)-192)/64;
        end
    end
end
imshow(NewImage3),title('彩虹编码')
(3)设计不同的平滑滤波、锐化滤波方法,查看处理效果
1.平滑滤波:
Image1=im2double(imread('lotus.bmp'));
gray=rgb2gray(Image1);
noisegaus=imnoise(gray,'gaussian'); %高斯噪声
figure;
subplot(121),imshow(gray),title('原图');
subplot(122),imshow(noisegaus),title('高斯噪声图');
result1=filter2(fspecial('average',3),noisegaus);
figure;
imshow(result1),title('3*3 均值滤波');
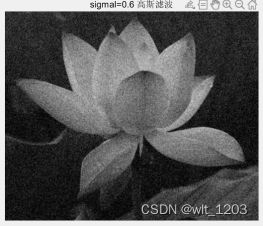
gausFilter=fspecial('gaussian',[2*3+1 2*3+1],0.6);
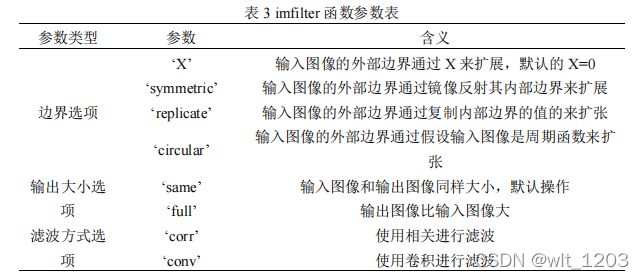
result2 = imfilter(noisegaus,gausFilter,'conv');
figure;
imshow(result2),title('sigmal=0.6 高斯滤波')
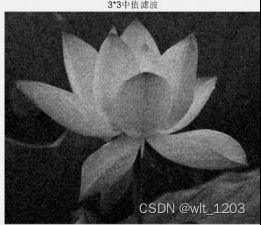
result3 = medfilt2(noisegaus);
figure;
imshow(result3),title('3*3 中值滤波');

image2 = imread('lotus.bmp');
image2 = imnoise(image2,'gaussian');
Fimage = fftshift(fft2(double(image2)));
[N M] = size(Fimage);
g = zeros(N,M);
r1 = floor(M/2); r2=floor(N/2);
d0 = [5 11 45 68];
for i = 1:4
    for x = 1:M
        for y = 1:N
            d = sqrt((x-r1)^2+(y-r2)^2);
            if d<=d0(i)
                h=1;
            else
                h=0;
            end
            g(y,x) = h*Fimage(y,x);
        end
    end
    g = real(ifft2(ifftshift(g)));
    figure,imshow(uint8(g)),title(['理想低通滤波 D0=',num2str(d0(i))]);
end
运行结果:
2.锐化滤波
Image1=im2double(imread('lotus.bmp'));
gray=rgb2gray(Image1);
H1=[-1 -2 -1;0 0 0;1 2 1];
H2=[-1 0 1;-2 0 2;-1 0 1];
R1=imfilter(gray,H1);
R2=imfilter(gray,H2);
edgeImage=abs(R1)+abs(R2);
sharpImage=gray+edgeImage;
figure;
subplot(121),imshow(edgeImage),title('Sobel 梯度图像');
subplot(122),imshow(sharpImage),title('Sobel 锐化图像 ');
H1=[1 0;0 -1]; H2=[0 1;-1 0]; R1=imfilter(gray,H1);
R2=imfilter(gray,H2); edgeImage=abs(R1)+abs(R2);
sharpImage=gray+edgeImage;
figure; subplot(121),imshow(edgeImage),title('Roberts 梯度图像 ');
subplot(122),imshow(sharpImage),title('Roberts 锐化图像 ');
H1=[-1 -1 -1;0 0 0;1 1 1];
H2=[-1 0 1;-1 0 1;-1 0 1];
R1=imfilter(gray,H1);
R2=imfilter(gray,H2);
edgeImage=abs(R1)+abs(R2);
sharpImage=gray+edgeImage;
figure;
subplot(121),imshow(edgeImage),title('Prewitt 梯度图像 ');
subplot(122),imshow(sharpImage),title('Prewitt 锐化图像 ');
H = fspecial('laplacian',0);
R = imfilter(gray,H);
edgeImage = abs(R);
H1 = [0 -1 0;-1 5 -1;0 -1 0];
sharpImage = imfilter(gray,H1);
figure;
subplot(121),imshow(edgeImage),title('Laplacian 滤波图 像');
subplot(122),imshow(sharpImage),title('Laplacian锐化图 像');
BW = edge(gray,'log');
H = fspecial('log',7,1);
R = imfilter(gray,H);
edgeImage = abs(R);
sharpImage = gray+edgeImage;
figure;
subplot(131),imshow(BW),title('LOG 边缘检测图像');
subplot(132),imshow(edgeImage),title('LOG 梯度图像');
subplot(133),imshow(sharpImage),title('LOG 锐化图像');
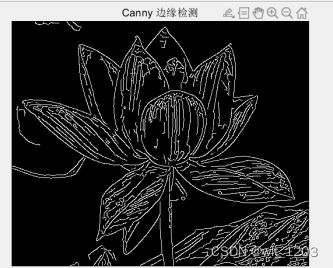
BW = edge(gray,'canny');
figure;
imshow(BW),title('Canny 边缘检测');
运行结果:
Sobel 算子效果图
Canny 算子效果图
(4)自行设计方法,实现对彩色图像增强处理。(Python、opencv实现)
import matplotlib.pyplot as plt
import cv2 as cv
import numpy as np

# 显示汉字用
plt.rcParams['font.sans-serif'] = ['SimHei']
plt.rcParams['axes.unicode_minus'] = False


# 定义坐标数字字体和大小
def label_def():
    plt.rcParams['font.sans-serif'] = ['SimHei']
    plt.rcParams['axes.unicode_minus'] = False


if __name__ == '__main__':
    # 读取图片
    img_orig = cv.imread('lotus.bmp', 1)  # 读取彩色图片
    # 伽马变换处理
    img_gama = np.power(img_orig.astype(np.float32), 1.5)  # 图像较亮,若采用幂率变换,y>1,压缩高灰度级
    temp1 = img_gama - np.min(img_gama)
    img_gama = temp1 / np.max(temp1)
    # 显示所用的变换函数
    x1 = np.linspace(img_orig.min(), img_orig.max(), num=200)
    y1 = np.power(x1, 1.5)  # 伽马函数

    plt.subplot(221), plt.title('原图像'), plt.imshow(cv.cvtColor(img_orig, cv.COLOR_BGR2RGB)), plt.axis('off')
    plt.subplot(223), plt.title('伽马变换'), plt.imshow(cv.cvtColor(img_gama, cv.COLOR_BGR2RGB)), plt.axis('off')
    plt.subplot(224), plt.title('s=r**(1.5)'), plt.plot(x1, y1), plt.grid, label_def()
    plt.show()
运行结果:


