coursera机器学习吴恩达-学习笔记-第三周
coursera机器学习吴恩达-学习笔记-第二周
1 logistic回归算法:二元分类
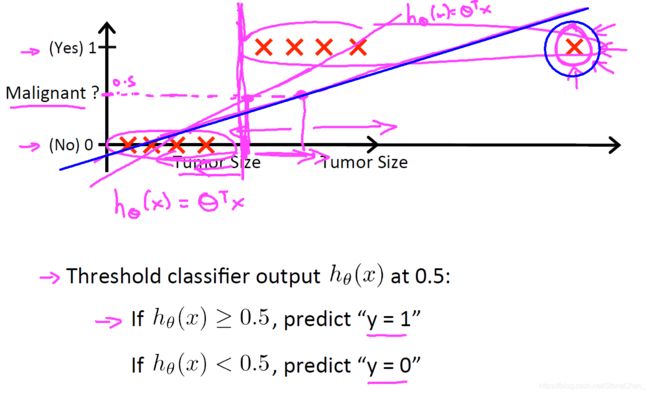
这里得出的 h θ ( x ) h_\theta(x) hθ(x)取值在0~1之间,在加入蓝圈的点之前,线性回归得出了紫色直线,整体上看符合需求,Tumor Size代入直线方程,如果得到的结果大于0.5则认为是恶性的。但是在加入蓝圈的样本时,线性回归的到的蓝色直线向下倾斜了,而此时的样本已经有恶性的样本被预测为了良性。所以线性回归不适合这类的问题。
2 假设陈述 Hypothesis Representation
根据0≤hθ(x)≤1;
做出新的模型
h θ ( x ) = g ( θ T x ) = 1 1 + e − θ T x h_\theta(x)=g(\theta^Tx)=\frac{1}{1+e^{-\theta^Tx}} hθ(x)=g(θTx)=1+e−θTx1
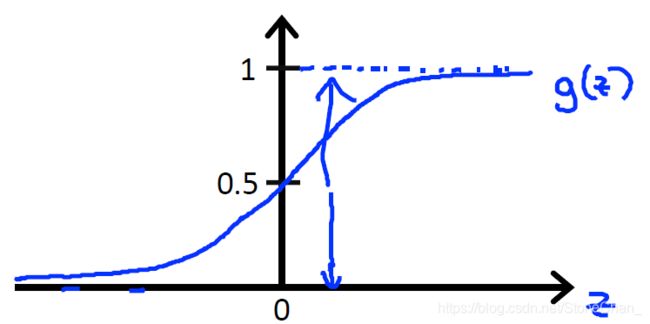
g ( z ) = 1 1 + e − z g(z)=\frac{1}{1+e^{-z}} g(z)=1+e−z1
g(z)这个函数称之为:logistic function 或者 sigmoid function(s型函数)
Ex:
i f x = [ x 0 x 1 ] = [ 1 t u m o r s i z e ] if x =\left[ \begin{matrix} x_0\\ x_1 \end{matrix} \right]= \left[ \begin{matrix} 1 \\ tumorsize \end{matrix} \right] if x=[x0x1]=[1tumorsize]
得出 h θ ( x ) = 0.7 h_\theta(x)=0.7 hθ(x)=0.7即表示 h θ ( x ) = P ( y = 1 ∣ x ; θ ) = 0.7 h_\theta(x)=P(y=1|_{x;\theta})=0.7 hθ(x)=P(y=1∣x;θ)=0.7
即有0.7的概率为恶性肿瘤。
3.1 决策边界 Decision Boundary
上面已经得出了y>0.5时为恶性,<0.5时为良性,那么就有一个边界可以划分y=1和y=0的部分。如下图所示。
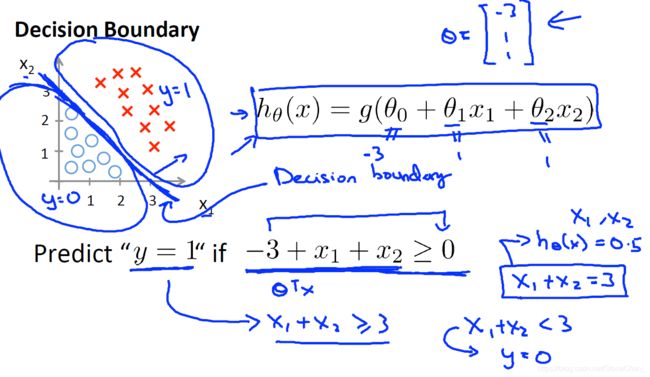
根据上图的边界可以认为 − 3 + x 1 + x 2 = 0 -3+x_1+x_2=0 −3+x1+x2=0为决策边界。
3.2 非线性决策边界 Non-linear decision boundaries
4 逻辑回归模型 logistic regression
4.1 代价函数 cost func
在加入训练集后得出 h θ ( x ) = 1 1 + e − θ T x h_\theta(x)=\frac{1}{1+e^{-\theta^Tx}} hθ(x)=1+e−θTx1
那么应该如何选择 θ \theta θ
所以引入代价函数 J ( θ ) = 1 2 m ∑ i = 1 m ( h θ ( x ( i ) ) , y ( i ) ) 2 J(\theta)=\frac{1}{2m}\sum_{i=1}^{m}{(h_\theta(x^{(i)}),y^{(i)})^2} J(θ)=2m1∑i=1m(hθ(x(i)),y(i))2
由于假设函数 h θ ( x ) h_\theta(x) hθ(x)的非线性,这样的代价函数可能是个非凸函数
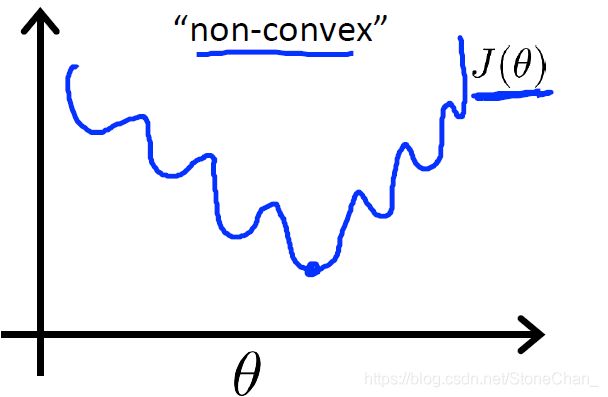
这样的话梯度下降不一定会收敛到全局最优解。
而我们希望代价函数是一个这样的凸函数
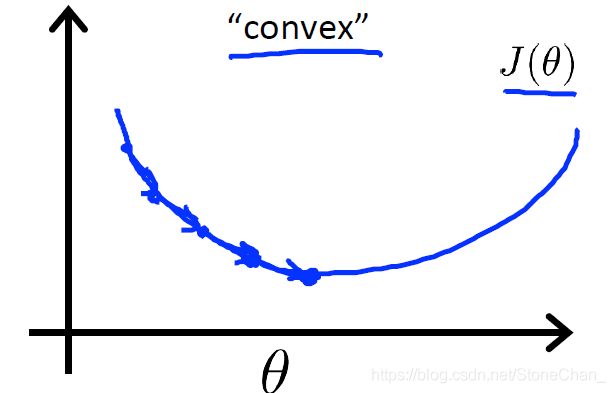
所以我们重新定义代价方程
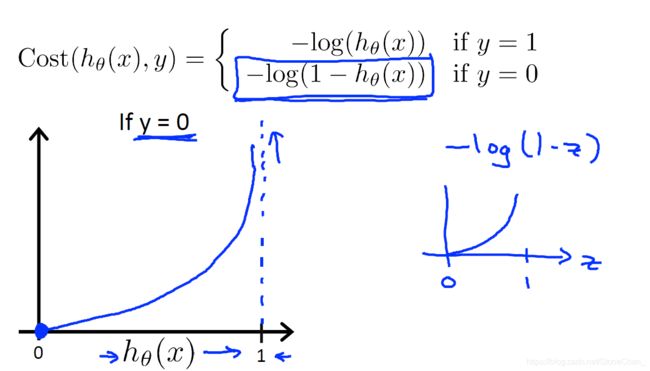
为了避免将 J ( θ ) J(\theta) J(θ)写成两个式子,需要合并成一个等式。
C o s t ( h θ ( x ) , y ) = − y l o g ( h θ ( x ) ) − ( 1 − y ) l o g ( 1 − h θ ( x ) ) Cost(h_\theta(x),y)=-ylog(h_\theta(x))-(1-y)log(1-h_\theta(x)) Cost(hθ(x),y)=−ylog(hθ(x))−(1−y)log(1−hθ(x))
J ( θ ) = 1 m ∑ i = 1 m c o s t ( h θ ( x ) ( i ) , y ( i ) ) J(\theta)=\frac{1}{m}\sum_{i=1}^{m}cost(h_\theta(x)^{(i)},y^{(i)}) J(θ)=m1∑i=1mcost(hθ(x)(i),y(i))
= − 1 m ∑ i = 1 m [ y ( i ) l o g ( h θ ( x ( i ) ) ) + ( 1 − y ) l o g ( 1 − h θ ( x ( i ) ) ) ] =-\frac{1}{m}\sum_{i=1}^{m}[y^{(i)}log(h_\theta(x^{(i)}))+(1-y)log(1-h_\theta(x^{(i)}))] =−m1∑i=1m[y(i)log(hθ(x(i)))+(1−y)log(1−hθ(x(i)))]
如果实际为1假设接近0,或者实际为0假设接近1,那么代价函数就会接近无穷大。
要想得到 m i n θ min_\theta minθ J ( θ ) J(\theta) J(θ),可以使用梯度下降法,步骤如下:
Repeat{
θ j : = θ j − α ∂ ∂ θ j J ( θ ) \theta_j:=\theta_j-\alpha\frac{\partial}{\partial\theta_j}J(\theta) θj:=θj−α∂θj∂J(θ)
}
其中 ∂ ∂ θ j J ( θ ) = 1 m ∑ i = 1 m ( h θ ( x ) ( i ) − y ( i ) ) x j ( i ) \frac{\partial}{\partial\theta_j}J(\theta)=\frac{1}{m}\sum_{i=1}^{m}(h_\theta(x)^{(i)}-y^{(i)})x_j^{(i)} ∂θj∂J(θ)=m1∑i=1m(hθ(x)(i)−y(i))xj(i)
5 高级优化
“共轭梯度Conjugate gradient”,“BFGS”和“L-BFGS”
是可以用来代替梯度下降来优化θ的更复杂,更快捷的方法。
function [jVal, gradient]
= costFunction(theta)
jVal = (theta(1)-5)^2 + (theta(2)-5)^2;
gradient = zeros(2,1);
gradient(1) = 2*(theta(1)-5);
gradient(2) = 2*(theta(2)-5);

%梯度目标参数打开&最大迭代次数100
options = optimset(‘GradObj’, ‘on’, ‘MaxIter’, ‘100’);
initialTheta = zeros(2,1);
[optTheta, functionVal, exitFlag] ...
= fminunc(@costFunction, initialTheta, options);
代价函数则定义为:
function [jVal, gradient] = costFunction(theta)
jVal = [code to compute J ( θ ) J(\theta) J(θ)];
gradient(1) = [ code to compute ∂ ∂ θ 0 J ( θ ) \frac{\partial}{\partial\theta_0}J(\theta) ∂θ0∂J(θ)];
gradient(2) = [ code to compute ∂ ∂ θ 1 J ( θ ) \frac{\partial}{\partial\theta_1}J(\theta) ∂θ1∂J(θ)];
…
gradient(n+1) = [ code to compute ∂ ∂ θ n J ( θ ) \frac{\partial}{\partial\theta_n}J(\theta) ∂θn∂J(θ)];
6 逻辑回归总结
1、逻辑回归模型:
h θ ( x ) = 1 1 + e − θ T x h_\theta(x)=\frac{1}{1+e^{-\theta^Tx}} hθ(x)=1+e−θTx1
2、代价函数:
J ( θ ) = − 1 m ∑ i = 1 m [ y ( i ) l o g ( h θ ( x ( i ) ) ) + ( 1 − y ( i ) ) l o g ( 1 − h θ ( x ( i ) ) ) ] J(\theta)=-\frac{1}{m}\sum_{i=1}^{m}[y^{(i)}log(h_\theta(x^{(i)}))+(1-y^{(i)})log(1-h_\theta(x^{(i)}))] J(θ)=−m1∑i=1m[y(i)log(hθ(x(i)))+(1−y(i))log(1−hθ(x(i)))]
3、梯度下降:
θ j : = θ j − α 1 m ∑ i = 1 m ( h θ ( x ) ( i ) − y ( i ) ) x j ( i ) \theta_j:=\theta_j-\alpha\frac{1}{m}\sum_{i=1}^{m}(h_\theta(x)^{(i)}-y^{(i)})x_j^{(i)} θj:=θj−αm1∑i=1m(hθ(x)(i)−y(i))xj(i)
7 多元分类问题
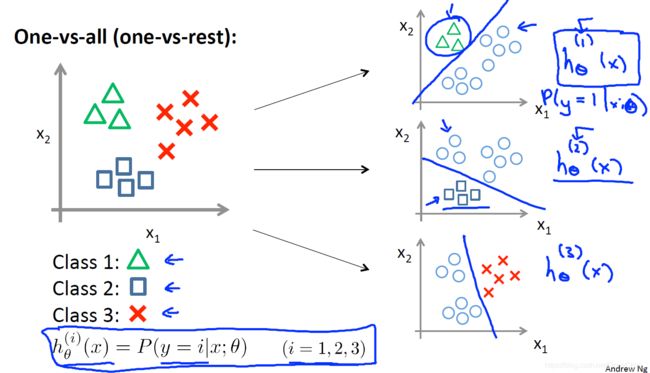
现在已经对每个class i 训练出了 h θ ( i ) ( x ) h_\theta^{(i)}(x) hθ(i)(x)来预测y=i的概率
一个新的x输入时,在3个分类器中输入x,然后选择最大的h。( m a x i h θ ( i ) ( x ) ) max_ih_\theta^{(i)}(x)) maxihθ(i)(x))
8 过拟合问题 overfitting
8.1过拟合现象
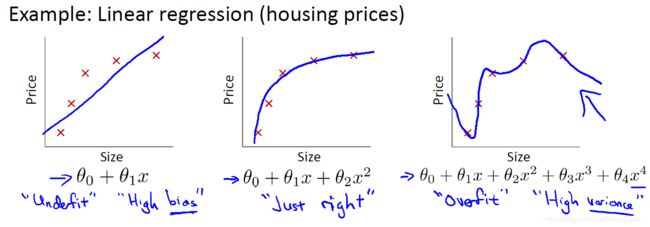
图一属于欠拟合或具有高偏差,图三属于过拟合或具有高方差。
变量过多时或阶数过高时可能会造成过拟合,使 J ( θ ) ≈ 0 J(\theta)\approx0 J(θ)≈0
导致它无法泛化到新样本中。对于逻辑回归同理。
(泛化generalize:一个假设模型应用到新样本的能力)
解决过拟合问题,可以通过两个办法:
1)减少特征的数量:
- 手动选择要保留的功能。
- 使用模型选择算法。
2)正则化
- 保留所有的特征,但是减小量级或参数θj的大小。
- 对变量多且每个变量都能对y产生影响的十分有效。
8.2 正则化
我们要消除θ3x3和θ4x4的影响,可以在函数中加入惩罚项,使θ3,θ4减小:
m i n θ 1 2 m ∑ i = 1 m ( h θ ( x ( i ) ) − y ( i ) ) 2 + 1000 θ 3 2 + 1000 θ 4 2 min_\theta\frac{1}{2m}\sum_{i=1}^{m}(h_\theta(x^{(i)})-y^{(i)})^2+1000\theta_3^2+1000\theta_4^2 minθ2m1∑i=1m(hθ(x(i))−y(i))2+1000θ32+1000θ42
这样有效减小了θ3和θ4的影响。但实际问题中,有太多的θ但无法确认哪些是高阶项,所以引入正则化参数λ:
J ( θ ) = 1 2 m [ ∑ i = 1 m ( h θ ( x ( i ) ) − y ( i ) ) 2 + λ ∑ i = 1 n θ j 2 J(\theta)=\frac{1}{2m}[\sum_{i=1}^{m}(h_\theta(x^{(i)})-y^{(i)})^2+\lambda\sum_{i=1}^{n}\theta_j^2 J(θ)=2m1[∑i=1m(hθ(x(i))−y(i))2+λ∑i=1nθj2
正则化项 λ ∑ i = 1 n θ j 2 \lambda\sum_{i=1}^{n}\theta_j^2 λ∑i=1nθj2缩小了所有的θ
λ:控制两个不同目标之间的取舍
1、训练更好的拟合数据,拟合训练集(前项)
2、保持参数尽量的小(后项)
λ越大对θ的惩罚越大,太大会使 h θ ( x ) = θ 0 h_\theta(x)=\theta_0 hθ(x)=θ0,导致欠拟合underfitting。
8.3 线性回归的正则化
8.3.1 梯度下降
R e p e a t Repeat Repeat{
θ 0 : = θ 0 − α 1 m ∑ i = 1 m ( h θ ( x ) ( i ) − y ( i ) ) x 0 ( i ) \theta_0 := \theta_0 - \alpha\frac{1}{m}\sum_{i=1}^{m}(h_\theta(x)^{(i)}-y^{(i)})x_0^{(i)} θ0:=θ0−αm1∑i=1m(hθ(x)(i)−y(i))x0(i)
θ j : = θ j − α 1 m ∑ i = 1 m ( h θ ( x ) ( i ) − y ( i ) ) x j ( i ) + λ m θ j \theta_j:=\theta_j-\alpha\frac{1}{m}\sum_{i=1}^{m}(h_\theta(x)^{(i)}-y^{(i)})x_j^{(i)}+\frac{\lambda}{m}\theta_j θj:=θj−αm1∑i=1m(hθ(x)(i)−y(i))xj(i)+mλθj
} ( j = 1,2,3,…,n)
其中 h θ ( x ) = θ 0 + θ 1 x + θ 2 x 2 + . . . h_\theta(x) = \theta_0+\theta_1x+\theta_2x^2+... hθ(x)=θ0+θ1x+θ2x2+...
θ j \theta_j θj可以整理成: θ j : = θ j ( 1 − α λ m ) − α 1 m ∑ i = 1 m ( h θ ( x ) ( i ) − y ( i ) ) x j ( i ) \theta_j:=\theta_j(1-\alpha\frac{\lambda}{m})- \alpha\frac{1}{m}\sum_{i=1}^{m}(h_\theta(x)^{(i)}-y^{(i)})x_j^{(i)} θj:=θj(1−αmλ)−αm1∑i=1m(hθ(x)(i)−y(i))xj(i)
直观上看,每次更新是θj的值就减小了一点。
8.3.2 正规方程
θ = ( X T X + λ [ 0 1 . . . 1 ] ) − 1 X T y \theta = (X^TX+\lambda\left[\begin{matrix}0&&&&&\\&1&&&&\\&&.&&&\\&&&.&&\\&&&&.&\\&&&&&1\end{matrix}\right])^{-1}X^Ty θ=(XTX+λ⎣⎢⎢⎢⎢⎢⎢⎡01...1⎦⎥⎥⎥⎥⎥⎥⎤)−1XTy
改矩阵 L L L是一个(n+1)*(n+1)的矩阵。
λ > 0 \lambda>0 λ>0 时 L L L 一定不是奇异矩阵。
8.4 逻辑回归的正则化
R e p e a t Repeat Repeat{
θ 0 : = θ 0 − α 1 m ∑ i = 1 m ( h θ ( x ) ( i ) − y ( i ) ) x 0 ( i ) \theta_0 := \theta_0 - \alpha\frac{1}{m}\sum_{i=1}^{m}(h_\theta(x)^{(i)}-y^{(i)})x_0^{(i)} θ0:=θ0−αm1∑i=1m(hθ(x)(i)−y(i))x0(i)
θ j : = θ j − α 1 m ∑ i = 1 m ( h θ ( x ) ( i ) − y ( i ) ) x j ( i ) + λ m θ j \theta_j:=\theta_j-\alpha\frac{1}{m}\sum_{i=1}^{m}(h_\theta(x)^{(i)}-y^{(i)})x_j^{(i)}+\frac{\lambda}{m}\theta_j θj:=θj−αm1∑i=1m(hθ(x)(i)−y(i))xj(i)+mλθj
} ( j = 1,2,3,…,n)
这个迭代看起来和上一节的迭代一样,但其实是不一样的,因为假设模型不同, h θ ( x ) = 1 1 + e − θ T x h_\theta(x)=\frac{1}{1+e^{-\theta^Tx}} hθ(x)=1+e−θTx1
代价函数为:
J ( θ ) = [ − 1 m ∑ i = 1 m y ( i ) l o g ( h θ ( x ( i ) ) ) + ( 1 − y ( i ) ) l o g ( 1 − h θ ( x ( i ) ) ) ] + λ 2 m ∑ j = 1 n θ j 2 J(\theta)=[-\frac{1}{m}\sum_{i=1}^{m}y^{(i)}log(h_\theta(x^{(i)}))+(1-y^{(i)})log(1-h_\theta(x^{(i)}))]+\frac{\lambda}{2m}\sum_{j=1}^{n}\theta_j^2 J(θ)=[−m1∑i=1my(i)log(hθ(x(i)))+(1−y(i))log(1−hθ(x(i)))]+2mλ∑j=1nθj2
其中 λ 2 m ∑ j = 1 n θ j 2 \frac{\lambda}{2m}\sum_{j=1}^{n}\theta_j^2 2mλ∑j=1nθj2正则化项防止θ1…θn过大。
∂ ∂ θ 0 J ( θ ) = 1 m ∑ i = 1 m ( h θ ( x ) ( i ) − y ( i ) ) x 0 ( i ) \frac{\partial}{\partial\theta_0}J(\theta)=\frac{1}{m}\sum_{i=1}^{m}(h_\theta(x)^{(i)}-y^{(i)})x_0^{(i)} ∂θ0∂J(θ)=m1∑i=1m(hθ(x)(i)−y(i))x0(i)
∂ ∂ θ 1 J ( θ ) = 1 m ∑ i = 1 m ( h θ ( x ) ( i ) − y ( i ) ) x 1 ( i ) + λ m θ 1 \frac{\partial}{\partial\theta_1}J(\theta)=\frac{1}{m}\sum_{i=1}^{m}(h_\theta(x)^{(i)}-y^{(i)})x_1^{(i)}+\frac{\lambda}{m}\theta_1 ∂θ1∂J(θ)=m1∑i=1m(hθ(x)(i)−y(i))x1(i)+mλθ1
…
9 编程练习
本次需要修改的.m文件如下所示。
[?] plotData.m - Function to plot 2D classication data
[?] sigmoid.m - Sigmoid Function
[?] costFunction.m - Logistic Regression Cost Function
[?] predict.m - Logistic Regression Prediction Function
[?] costFunctionReg.m - Regularized Logistic Regression Cost
9.1.1 part1.1
%% ==================== Part 1: Plotting ====================
%  We start the exercise by first plotting the data to understand the
%  the problem we are working with.

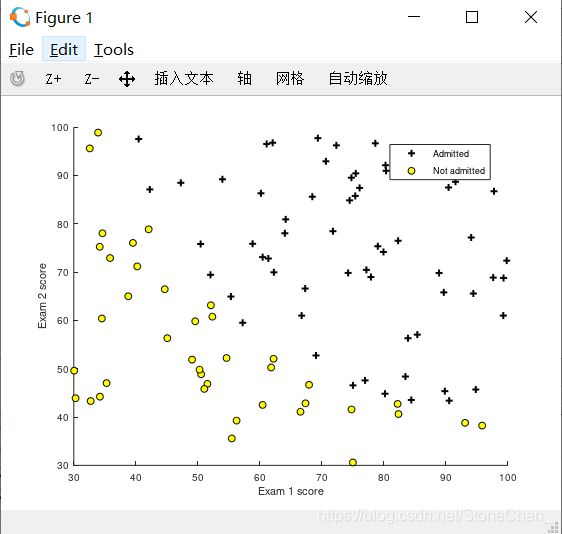
%第一部分是需要将pos和neg的点打到坐标系上。通过修改plotData.m实现。

% Find Indices of Positive and Negative Examples
pos = find(y==1); neg = find(y == 0);
% Plot Examples
plot(X(pos, 1), X(pos, 2), 'k+','LineWidth', 2, ...
'MarkerSize', 7);
plot(X(neg, 1), X(neg, 2), 'ko', 'MarkerFaceColor', 'y', ...
'MarkerSize', 7);
9.1.2 part1.2
%% ============ Part 2: Compute Cost and Gradient ============
%  In this part of the exercise, you will implement the cost and gradient
%  for logistic regression. You neeed to complete the code in
%  costFunction.m

%第二部分是逻辑回归的代价函数和梯度下降

J = 1/m*(-y'*log(sigmoid(X*theta)) - (1-y)'*(log(1-sigmoid(X*theta))));
grad = 1/m * X'*(sigmoid(X*theta) - y);
即以下两个方程:
J ( θ ) = − 1 m ∑ i = 1 m [ y ( i ) l o g ( h θ ( x ( i ) ) ) + ( 1 − y ( i ) ) l o g ( 1 − h θ ( x ( i ) ) ) ] J(\theta)=-\frac{1}{m}\sum_{i=1}^{m}[y^{(i)}log(h_\theta(x^{(i)}))+(1-y^{(i)})log(1-h_\theta(x^{(i)}))] J(θ)=−m1∑i=1m[y(i)log(hθ(x(i)))+(1−y(i))log(1−hθ(x(i)))]
θ j : = θ j − α 1 m ∑ i = 1 m ( h θ ( x ) ( i ) − y ( i ) ) x j ( i ) \theta_j:=\theta_j-\alpha\frac{1}{m}\sum_{i=1}^{m}(h_\theta(x)^{(i)}-y^{(i)})x_j^{(i)} θj:=θj−αm1∑i=1m(hθ(x)(i)−y(i))xj(i)
第二部分输出θ,J(θ)的值
Cost at initial theta (zeros): 0.693147
Expected cost (approx): 0.693
Gradient at initial theta (zeros):
 -0.100000
 -12.009217
 -11.262842
Expected gradients (approx):
 -0.1000
 -12.0092
 -11.2628

Cost at test theta: 0.218330
Expected cost (approx): 0.218
Gradient at test theta:
 0.042903
 2.566234
 2.646797
Expected gradients (approx):
 0.043
 2.566
 2.647

Program paused. Press enter to continue.
9.1.3 part1.3
%% ============= Part 3: Optimizing using fminunc  =============
%  In this exercise, you will use a built-in function (fminunc) to find the
%  optimal parameters theta.

%第三部分要求利用matlab内部的函数fminunc去找到最优参数θ

%梯度目标参数打开&最大迭代次数400
options = optimset('GradObj', 'on', 'MaxIter', 400);

%  运行fminunc去找到最优参数θ
%  This function will return theta and the cost
[theta, cost] = ...
	fminunc(@(t)(costFunction(t, X, y)), initial_theta, options);
通过fminunc找的的θ和代价函数结果如下:
Cost at theta found by fminunc: 0.203498
Expected cost (approx): 0.203
theta:
 -25.161272
 0.206233
 0.201470
Expected theta (approx):
 -25.161
 0.206
 0.201
9.1.4 part1.4
%% ============== Part 4: Predict and Accuracies ==============
%  After learning the parameters, you'll like to use it to predict the outcomes
%  on unseen data. In this part, you will use the logistic regression model
%  to predict the probability that a student with score 45 on exam 1 and
%  score 85 on exam 2 will be admitted.
%
%  Furthermore, you will compute the training and test set accuracies of
%  our model.
%
%  Your task is to complete the code in predict.m

%第四部分给了一个学生,考试1的成绩为45,考试2的成绩为85,
%要我们预测该学生是否能被录取。将在predict.m中增加。

p = sigmoid(X * theta)>=0.5;
sigmoid函数为s型函数: g ( z ) = 1 1 + e − z g(z)=\frac{1}{1+e^{-z}} g(z)=1+e−z1
h θ ( x ) = 1 1 + e − θ T x h_\theta(x)=\frac{1}{1+e^{-\theta^Tx}} hθ(x)=1+e−θTx1
由前面part的结果可知,theta维度是 3 × 1 3\times1 3×1的矩阵,样本矩阵X需要为 n × 3 n\times3 n×3,第一列都为1。
预测矩阵a中 a 0 = 1 , a 1 = 45 , a 2 = 85 a_0=1,a_1=45, a_2=85 a0=1,a1=45,a2=85
prob = sigmoid([1 45 85] * theta);
p = predict(theta, X);
结果如下:
For a student with scores 45 and 85, we predict an admission probability of 0.776289
Expected value: 0.775 +/- 0.002

Train Accuracy: 89.000000
Expected accuracy (approx): 89.0
9.2 part2正则化逻辑回归
9.2.1 part2.1
%% =========== Part 1: Regularized Logistic Regression ============
%  In this part, you are given a dataset with data points that are not
%  linearly separable. However, you would still like to use logistic
%  regression to classify the data points.
%
%  To do so, you introduce more features to use -- in particular, you add
%  polynomial features to our data matrix (similar to polynomial
%  regression).

%第一部分绘制散点图,并且通过costFunctionReg计算cost and gradient
%其中with all-ones theta and lambda = 10

J = 1/m * (-y' * log(sigmoid(X*theta)) - (1 - y') * log(1 - sigmoid(X * theta)))...
        + lambda/2/m*sum(theta(2:end).^2);

grad(1,:) = 1/m * (X(:, 1)' * (sigmoid(X*theta) - y));
grad(2:size(theta), :) = 1/m * (X(:, 2:size(theta))' * (sigmoid(X*theta) - y))...
        + lambda/m*theta(2:size(theta), :);
即实现以下两个公式:
θ j : = θ j − α 1 m ∑ i = 1 m ( h θ ( x ) ( i ) − y ( i ) ) x j ( i ) + λ m θ j \theta_j:=\theta_j-\alpha\frac{1}{m}\sum_{i=1}^{m}(h_\theta(x)^{(i)}-y^{(i)})x_j^{(i)}+\frac{\lambda}{m}\theta_j θj:=θj−αm1∑i=1m(hθ(x)(i)−y(i))xj(i)+mλθj
J ( θ ) = [ − 1 m ∑ i = 1 m y ( i ) l o g ( h θ ( x ( i ) ) ) + ( 1 − y ( i ) ) l o g ( 1 − h θ ( x ( i ) ) ) ] + λ 2 m ∑ j = 1 n θ j 2 J(\theta)=[-\frac{1}{m}\sum_{i=1}^{m}y^{(i)}log(h_\theta(x^{(i)}))+(1-y^{(i)})log(1-h_\theta(x^{(i)}))]+\frac{\lambda}{2m}\sum_{j=1}^{n}\theta_j^2 J(θ)=[−m1∑i=1my(i)log(hθ(x(i)))+(1−y(i))log(1−hθ(x(i)))]+2mλ∑j=1nθj2
9.2.2 part2.2
%% ============= Part 2: Regularization and Accuracies =============
%  Optional Exercise:
%  In this part, you will get to try different values of lambda and
%  see how regularization affects the decision coundart
%
%  Try the following values of lambda (0, 1, 10, 100).
%
%  How does the decision boundary change when you vary lambda? How does
%  the training set accuracy vary?

%第二部分画出决策边界,将尝试不同的lambda看看正则化是如何影响决策的。
% Set regularization parameter lambda to 1 (you should vary this)
lambda = 1;
课程提供了plotDecisionBoundary.m函数,绘制分隔正例和负例的(非线性)决策边界。 在plotDecisionBoundary.m中,通过在均匀间隔的网格上计算分类器的预测来绘制非线性决策边界,然后画出预测从y = 0变化到y = 1的等高线图。
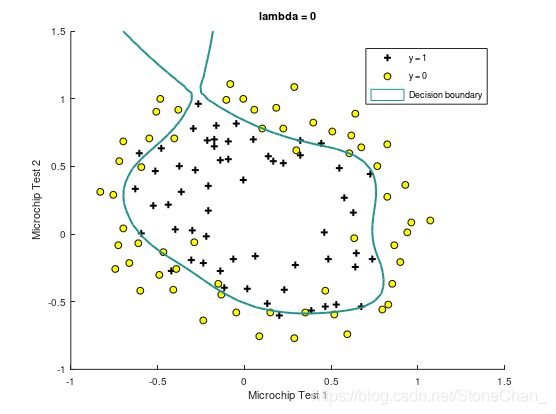
Train Accuracy: 86.440678
Expected accuracy (with lambda = 0): 83.1 (approx)
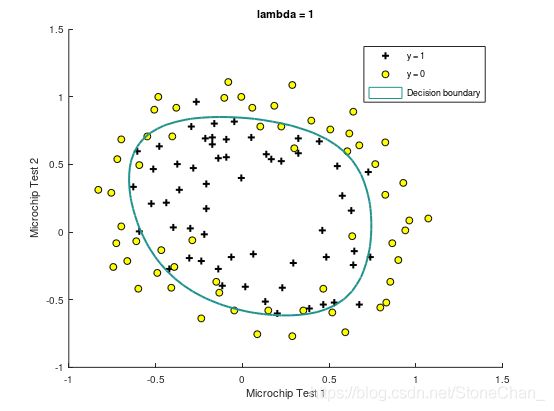
Train Accuracy: 83.050847
Expected accuracy (with lambda = 1): 83.1 (approx)
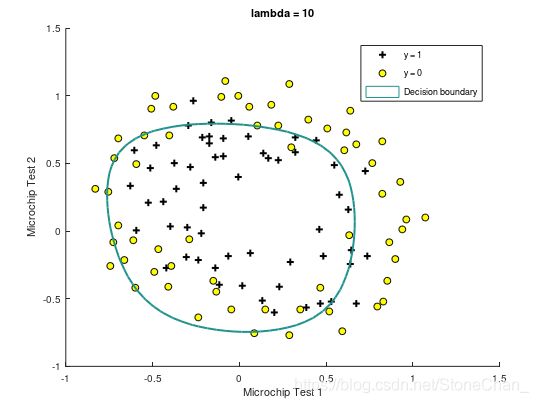
Train Accuracy: 74.576271
Expected accuracy (with lambda = 10): 83.1 (approx)
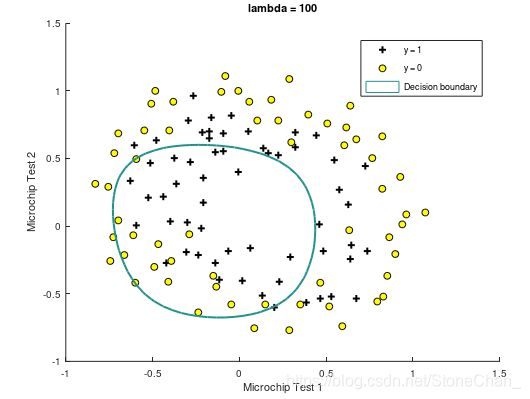
Train Accuracy: 61.016949
Expected accuracy (with lambda = 100): 83.1 (approx)
