一、圆形区域的画图
1、
clear all

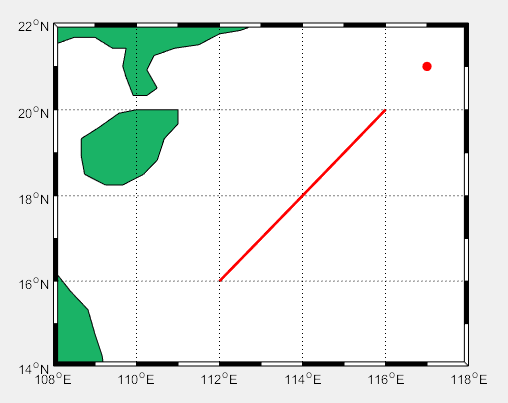
LATLIMS=[14 22];
LONLIMS=[108 118];%南海边界范围
m_proj('miller','lon',LONLIMS,'lat',LATLIMS);%投影模式
m_coast('patch',[0.1 0.7 0.4]);%绿色填充
m_grid('box','fancy','tickdir','in');%没有网格,边框相间,%m_line(lon,lat,'linewi',2,'color','r','linestyle',':');控制线条格式,点画线还是直线

lon=112:1:116;
lat=16:1:20;
m_line(lon,lat,'linewi',2,'color','r');%线宽,2;颜色

[X,Y]=m_ll2xy(117,21);
line(X,Y,'marker','.','markersize',24','color','r')%画点
2、距离
clear all
%distance用法
arclen=distance([37,0],[35,0])%返回两点间的相对球心的角度,以度为单位
d=distance([37,0],[35,0],6371)% [纬度,经度] [纬度,经度] [半径]
D=(arclen/180)*pi*6371
%m_map中函数
dist=m_lldist([0 0],[35 37])%[经度 经度] [纬度 纬度]
3、
%画出矩形散点图和圆形图
clear all

LATLIMS=[14 22];
LONLIMS=[108 118];%南海边界范围
m_proj('lambert','lon',LONLIMS,'lat',LATLIMS);%投影模式
m_coast('patch',[0.1 0.7 0.4]);%绿色填充
m_grid('box','fancy','tickdir','in');%没有网格,边框相间,%m_line(lon,lat,'linewi',2,'color','r','linestyle',':');控制线条格式,点画线还是直线

load EDH_south_sea_2008
load coordi_south_sea_2008

m_range_ring(114.0623,17.9532,[1e2:1e2:3e2],'linewi',2,'color','b');%红色300km范围圆圈

% 矩形点阵
range_lat=4:24;%21N和15N对应的位置下标
range_lon=20:40;%111.5E和116.5E对应的下标
for i=1:length(range_lon)
    for j=1:length(range_lat)
        [X,Y]=m_ll2xy(lon_south_sea(range_lon(i)),lat_south_sea(range_lat(j)));%化为x,y坐标
        line(X,Y,'marker','.','markersize',10,'color','k')%画点
        hold on
    end
end

%离散圆
[X0,Y0]=m_ll2xy(114.0623,17.9532);%圆心化为x,y坐标
line(X0,Y0,'marker','.','markersize',15,'color','r');%画圆心
DIST=m_lldist([114 115],[18 18])%经度加1度,增加的距离
R=300;%300km
[X1,Y1]=m_ll2xy(114.0623-R/DIST,17.9532);%找到300km的一个点

r=sqrt((X0-X1)^2+(Y0-Y1)^2);%地图距离到图上距离转换
r=linspace(0,r,10);%等分成9份
for i=1:10
    theta=0:pi/45:2*pi;%360度,91个点。0到2pi
    x=X0+r(i)*cos(theta); %(X0,Y0)圆心
    y=Y0+r(i)*sin(theta);
    plot(x,y,'.','markersize',6,'color','r')
end
4、pcolor
clear all
n =18;
r = (0:n)'/n;
theta = pi*(-n:n)/n;
X = r*cos(theta);
Y = r*sin(theta);
C = r*cos(2*theta);
pcolor(X,Y,C)
axis equal tight
colorbar

figure
load PCOLOR %南海坐标和波导高度数据
colormap('jet');
shading flat;%平滑方式
gca=pcolor(Plg,Plt,EDH_south_sea)
set(gca, 'LineStyle','none');%去除网格
axis equal tight %按比例展示
colorbar %颜色条
clear all

LATLIMS=[2 22];
LONLIMS=[105 121];%南海边界范围
m_proj('miller','lon',LONLIMS,'lat',LATLIMS);%投影模式


load coordi_south_sea_2008 %载入南海经纬度信息
load EDH_south_sea_2008
for i=1:length(lon_south_sea) %经度
    [X,Y]=m_ll2xy(lon_south_sea(i),12);%化为x,y坐标,12是纬度的平均值
    lon(i)=X;
end
for i=1:length(lat_south_sea) %经度
    [X,Y]=m_ll2xy(113,lat_south_sea(i));%化为x,y坐标,113是经度的平均值
    lat(i)=Y;
end

[Plg,Plt]=meshgrid(lon,lat);%经纬度 形成网格

colormap('jet');
shading flat;%平滑方式
gca=pcolor(Plg,Plt,EDH_south_sea)
set(gca, 'LineStyle','none');%去除网格
axis equal tight %按比例展示
colorbar %颜色条

m_coast('patch',[0.1 0.7 0.4]);%绿色填充
m_grid('box','fancy','tickdir','in');
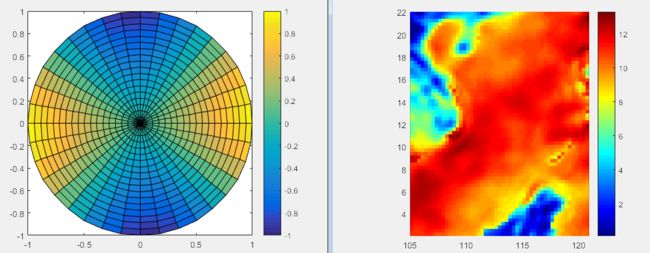
左右两幅图对比,左边是将经纬度换为xy值后画的图,更改绘图模式,利用pcolor画的,看出上边边缘有的吻合不是太好;右图是直接利用m_pcolor画的,吻合度更好
相当于载入了一幅地图,先将其经纬度化为正常的坐标,然后再在上面画图。
5、
clear all
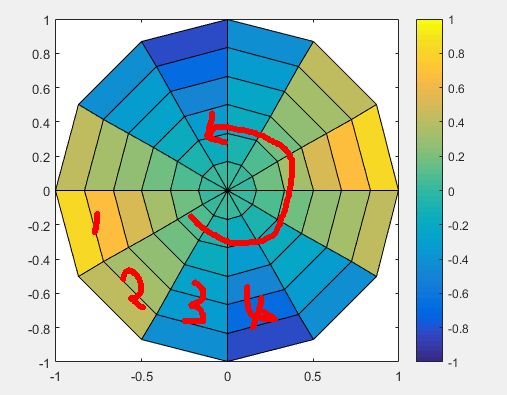
n =6;
r = (0:n)'/n;%0到6,半径上均分的数
theta = pi*(-n:n)/n;%将整个圆分成了13分。
X = r*cos(theta);
Y = r*sin(theta);
C = r*cos(2*theta);
pcolor(X,Y,C)
axis equal tight
colorbar
6、
%温度绘图,只读取南海数据绘图
clear all
load EDH_south_sea_2008
load coordi_south_sea_2008
LATLIMS=[14 22];
LONLIMS=[108 118];%南海边界范围
m_proj('lambert','lon',LONLIMS,'lat',LATLIMS);%投影模式

hold on %一定要有,否则地图会被覆盖

%%
%将经纬度换成坐标轴
for i=1:length(lon_south_sea) %经度
    [X,Y]=m_ll2xy(lon_south_sea(i),18);%化为x,y坐标,12是纬度的平均值
    lon(i)=X;
end
for i=1:length(lat_south_sea) %经度
    [X,Y]=m_ll2xy(114,lat_south_sea(i));%化为x,y坐标,113是经度的平均值
    lat(i)=Y;
end

%%
%圆形点图数据
%m_range_ring(114.0623,17.9532,[3e2],'linewi',2,'color','b');%红色300km范围圆圈
%离散圆
[X0,Y0]=m_ll2xy(114.0623,17.9532);%圆心化为x,y坐标
%[X0,Y0]=m_ll2xy(114.0623,5);%圆心化为x,y坐标
%line(X0,Y0,'marker','.','markersize',15,'color','r');%画圆心
DIST=m_lldist([114 115],[18 18]);%经度加1度,增加的距离
R=300;%300km
[X1,Y1]=m_ll2xy(114.0623-R/DIST,17.9532);%找到300km的一个点
%[X1,Y1]=m_ll2xy(114.0623-R/DIST,5);%找到300km的一个点
theta=0:pi/45:2*pi;%360度,91个点。0到2pi
r=sqrt((X0-X1)^2+(Y0-Y1)^2);%地图距离到图上距离转换
r=linspace(0,r,10);%等分成10份
%theta=0:pi/45:2*pi;%360度,91个点。0到2pi

%%
%定义装位置和数值的空矩阵
circle_x=zeros(length(r),length(theta));
circle_y=zeros(length(r),length(theta));
circle_EDH=zeros(length(r),length(theta));
%%
%N*2D方式,一共生成了91条线,每条线上有10个数据,
for i=1:length(r)
    x=X0+r(i)*cos(theta); %(X0,Y0)圆心,得到想要获取的EDH的位置(x,y)
    y=Y0+r(i)*sin(theta);
    for j=1:length(theta)
        [min_lon,lon_index]=min(abs(lon-x(j)));%得到最匹配的x轴的值
        [min_lat,lat_index]=min(abs(lat-y(j)));%得到最匹配的y轴的值
        circle_EDH(i,j)=EDH_south_sea(lat_index,lon_index);%存储蒸发波导高度
    end
    circle_x(i,:)=x;
    circle_y(i,:)=y;
    %plot(x,y,'.','markersize',6,'color','r')
end
%%
%画图
colormap('jet');
shading flat;%平滑方式
gca=pcolor(circle_x,circle_y,circle_EDH)
set(gca, 'LineStyle','none');%去除网格
axis equal tight %按比例展示
% colorbar %颜色条

c=colorbar('eastoutside','fontsize',12)
%caxis([0,14])%颜色条范围限制
title( '2008年南海平均蒸发波导高度','fontsize',15);%[a b c d]确定绘图区域的位置, [a b]为绘图区域左下点的坐标。
m_coast('patch',[0.1 0.7 0.4]);%绿色填充
m_grid('box','fancy','tickdir','in');         %c,d分别为绘图区域的宽和高。
这样可以看到,靠近岸的地方温度低,靠近海的地方温度高。
7、获取路径损失数据图
%获取圆形区域路径损失数据
clear all;
% load testUsrDef.mat
tic
freq = 8000;    % in MHz频率
thetabw = 2;    % in deg 3分贝波束宽度
thetae = 0; % in deg 仰角度数
polrz = 1;  % 1 for horizontal polarization 水平极化, 2 for vertical polarization 极化方式
tx_height = 3;  % tx_antenna height, in m,天线高度
range = 300; % calcu range, in km,水平传播距离
zmax_user = 100;    % maximum height (max desired calculation height), in m,电波限高
rx_height=3;%接收天线高度
delx = 100; % range step, in m,距离步进值迭代设置
delz = 0.1;    % altitude step, in m,高度步进值
%%
%%地形设置
edge_range = [ 20 30 50 ];   % array of edge range, in km,地形限制
edge_height = [ 5 20 7 ];    % array of edge heights at edge ranges, in m,地形高度;???无效?
terrain_type = 1;   % tarrain type, 1 for no terrain case, 2 for terrain case
interp_type = 2;    % edge interp type, 2 for linear, 3 for cubic spline
backward = 1;   % 1 for 1-way SSPE, 2 for 2-way SSPE

%% 海洋表面参数
ground_type = 1;    % ground type, 1 for PEC, 2 for mixed
epsilon = 69.13;    % dielectric constant 介电常数
sigma = 7.146;  % conductivity 电导率
%%
%预留数据空间
load CIRCLE_EDH  % 10*91 91次循环,91条线,10个蒸发波导高度
circle_path_loss=zeros(10*range+1,length(circle_EDH));
circle_pl_x=zeros(10*range+1,length(circle_EDH));
circle_pl_y=zeros(10*range+1,length(circle_EDH));

%% 波导条件设置
% duct_type = 5;  % duct type, 1 for standard atmosphere, 3 for surface-based duct, 5 for evaporation duct
% duct_M =  [360 0];%必须带0;
% duct_height = [15 0]; %必须带0
% duct_range = 1; %???水平不均匀性的设置

% duct_type = 5;  % duct type, 1 for standard atmosphere, 3 for surface-based duct, 5 for evaporation duct
% duct_M =  [360 0 ;300 0;344 0];
% duct_height = [15 0;18 0; 20 0];
% duct_range =[0 100 200]; %水平不均匀性的设置,0km处蒸发波导高度15m,100km处蒸发波导高度5m,200km处蒸发波导高度20m.
for i=1:length(circle_EDH)
    duct_type = 5;  % duct type, 1 for standard atmosphere, 3 for surface-based duct, 5 for evaporation duct

    duct_M=zeros(10,2);

    duct_height = zeros(10,2);
    duct_height(:,1)=circle_EDH(:,i);%获取第i列(线)波导高度
    duct_range =linspace(0,300,10); %水平不均匀性的设置,0km处蒸发波导高度15m,100km处蒸发波导高度5m,200km处蒸发波导高度20m.
    %计算路径损失
    [umat, path_loss, prop_fact, free_space_loss, range_vec, z_user, z, stopflag] =  SSPE_function(freq, ...
        thetabw, thetae, polrz, tx_height, range, zmax_user, edge_range, edge_height, ...
        duct_type, duct_M, duct_height, duct_range, terrain_type, interp_type, backward, ...
        ground_type, epsilon, sigma, delx, delz);
    circle_path_loss(:,i)=path_loss(rx_height*10,:);

end
%计算坐标
for i=1:length(circle_EDH)
   circle_pl_x(:,i)=linspace(circle_x(1,i),circle_x(10,i),10*range+1);
   circle_pl_y(:,i)=linspace(circle_y(1,i),circle_y(10,i),10*range+1);
end
toc
save CIRCLE_PATH_LOSS circle_path_loss circle_pl_x circle_pl_y
8、圆形路径损失图
%圆形路径损失绘制
clear all
LATLIMS=[14 22];
LONLIMS=[108 118];%南海边界范围
m_proj('lambert','lon',LONLIMS,'lat',LATLIMS);%投影模式
hold on %一定要有,否则地图会被覆盖
%%
load CIRCLE_PATH_LOSS
%%
%画图
colormap('jet');
shading flat;%平滑方式
gca=pcolor(circle_pl_x,circle_pl_y,circle_path_loss);
set(gca, 'LineStyle','none');%去除网格
axis equal tight ;%按比例展示
%colorbar %颜色条

c=colorbar('eastoutside','fontsize',12);
caxis([100,220]);%颜色条范围限制
m_coast('patch',[0.1 0.7 0.4]);%绿色填充
m_grid('box','fancy','tickdir','in');         %c,d分别为绘图区域的宽和高。


