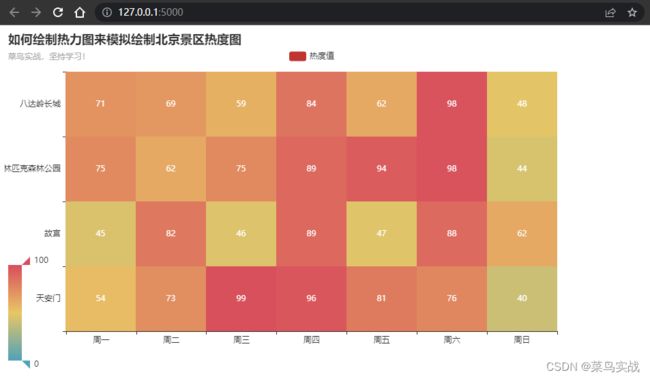
【Python 实战基础】如何绘制热力图来模拟绘制北京景区热度图
目录
一、实战场景
二、主要知识点
文件读写
基础语法
字符串处理
文件生成
数据构建
三、菜鸟实战
1、创建 python 文件
2、运行结果
一、实战场景
实战场景:如何绘制热力图来模拟绘制北京景区热度图
二、主要知识点
文件读写
基础语法
字符串处理
文件生成
数据构建
三、菜鸟实战
马上安排!
1、创建 python 文件
"""
Author: 菜鸟实战
实战场景:  如何绘制热力图来模拟绘制北京景区热度图
"""

# 导入系统包
import platform
from flask import Flask, render_template
from pyecharts import options as opts
from pyecharts.charts import *

print("Hello,菜鸟实战")
print("实战场景:  如何绘制热力图来模拟绘制北京景区热度图 \n")

web = Flask(__name__)

# 数据构建
x_index = ["周一", "周二", "周三", "周四", "周五", "周六", "周日"]
y_index = ["天安门", "故宫", "奥林匹克森林公园", "八达岭长城"]
y_value = [[0, 0, 54], [0, 1, 45], [0, 2, 75], [0, 3, 71],
           [1, 0, 73], [1, 1, 82], [1, 2, 62], [1, 3, 69],
           [2, 0, 99], [2, 1, 46], [2, 2, 75], [2, 3, 59],
           [3, 0, 96], [3, 1, 89], [3, 2, 89], [3, 3, 84],
           [4, 0, 81], [4, 1, 47], [4, 2, 94], [4, 3, 62],
           [5, 0, 76], [5, 1, 88], [5, 2, 98], [5, 3, 98],
           [6, 0, 40], [6, 1, 62], [6, 2, 44], [6, 3, 48]]


def heatMap_charts() -> HeatMap():
    # 实例化对象
    heatMap = HeatMap()
    heatMap.add_xaxis(x_index)
    heatMap.add_yaxis("热度值", y_index, y_value, label_opts=opts.LabelOpts(is_show=True, position="inside"))
    # # 全局置标题、标签
    heatMap.set_global_opts(
        title_opts=opts.TitleOpts(title="如何绘制热力图来模拟绘制北京景区热度图", subtitle="菜鸟实战,坚持学习!"),
        legend_opts=opts.LegendOpts(type_="scroll", pos_top="5%"),
        visualmap_opts=opts.VisualMapOpts()
    )
    return heatMap


# 获取对象
p = heatMap_charts()
# 绘制图形,生成HTML文件的
p.render('./templates/heatMap_charts.html')


# 添加路由显示图表
@web.route('/')
def index():
    return render_template('heatMap_charts.html')


if __name__ == "__main__":
    # 运行项目
    web.run(debug=False)

print("Python 版本", platform.python_version())
2、运行结果
Hello,菜鸟实战
实战场景: 如何绘制热力图来模拟绘制北京景区热度图* Serving Flask app 'py035' (lazy loading)
* Environment: production
WARNING: This is a development server. Do not use it in a production deployment.
Use a production WSGI server instead.
* Debug mode: off
* Running on http://127.0.0.1:5000 (Press CTRL+C to quit)
菜鸟实战,持续学习!
