实战:prometheus应用监控(监控k8s集群的CoreDns和redis服务)-2022.5.1(测试成功)

前面我们和大家介绍了 Prometheus 的数据指标是通过一个公开的 HTTP(S) 数据接口获取到的,我们不需要单独安装监控的 agent,只需要暴露一个 metrics 接口,Prometheus 就会定期去拉取数据;对于一些普通的 HTTP 服务,我们完全可以直接重用这个服务,添加一个 /metrics 接口暴露给 Prometheus;而且获取到的指标数据格式是非常易懂的,不需要太高的学习成本。
现在很多服务从一开始就内置了一个 /metrics 接口,比如 Kubernetes 的各个组件、istio 服务网格都直接提供了数据指标接口。有一些服务即使没有原生集成该接口,也完全可以使用一些 exporter 来获取到指标数据,比如 mysqld_exporter、node_exporter,这些 exporter 就有点类似于传统监控服务中的 agent,作为服务一直存在,用来收集目标服务的指标数据然后直接暴露给 Prometheus。
目录
文章目录
-
- 目录
- 实验环境
- 实验软件
- 前置条件
- 1.普通应用:监控k8s集群的CoreDns服务
-
- 1.查看CoreDns是否开启/metric接口
- 2.将CoreDns的/metrics接口配置到prometheus的ConfigMap
- 3.验证
- 2.使用 exporter 监控:监控k8s集群的redis应用
-
- 1.创建pod资源
- 2.更新Prometheus 的配置文件
- 3.验证
- 关于我
- 最后
- 最后
实验环境
k8s:v1.22.2(1 master,2 node)
containerd: v1.5.5
prometneus: docker.io/prom/prometheus:v2.34.0
实验软件
链接:https://pan.baidu.com/s/1qngIIlrb_wZNefjK2C-EBw?pwd=i435
提取码:i435
2022.4.30-p8s应用监控demo-code
前置条件
- 具有k8s环境;
- 已经把prometheus应用部署到k8s环境里;
关于如何将prometheus应用部署到k8s环境里,请查看我的另一篇文章,获取完整的部署方法!。
https://blog.csdn.net/weixin_39246554/article/details/124498172?spm=1001.2014.3001.5501


1.普通应用:监控k8s集群的CoreDns服务
对于普通应用只需要能够提供一个满足 prometheus 格式要求的 /metrics 接口就可以让 Prometheus 来接管监控。
1.查看CoreDns是否开启/metric接口
- 比如 Kubernetes 集群中非常重要的 CoreDNS 插件,一般默认情况下就开启了
/metrics接口:
➜ kubectl get cm coredns -n kube-system -o yaml
apiVersion: v1
data:
  Corefile: |
    .:53 {
        errors
        health
        ready
        kubernetes cluster.local in-addr.arpa ip6.arpa {
           pods insecure
           fallthrough in-addr.arpa ip6.arpa
           ttl 30
        }
        prometheus :9153
        forward . /etc/resolv.conf
        cache 30
        loop
        reload
        loadbalance
    }
kind: ConfigMap
metadata:
  creationTimestamp: "2019-11-08T11:59:49Z"
  name: coredns
  namespace: kube-system
  resourceVersion: "188"
  selfLink: /api/v1/namespaces/kube-system/configmaps/coredns
  uid: 21966186-c2d9-467a-b87f-d061c5c9e4d7
上面 ConfigMap 中 prometheus :9153 就是开启 prometheus 的插件。
- 查看下当前k8s集群的CoreDns pod信息
[root@master1 p8s-example]#kubectl get pods -n kube-system -l k8s-app=kube-dns -o wide
NAME                       READY   STATUS    RESTARTS       AGE    IP            NODE      NOMINATED NODE   READINESS GATES
coredns-7568f67dbd-2ztgw   1/1     Running   1 (100d ago)   148d   10.244.0.8    master1   <none>           <none>
coredns-7568f67dbd-9dls5   1/1     Running   1 (100d ago)   169d   10.244.0.10   master1   <none>           <none>
- 我们可以先尝试手动访问下
/metrics接口,如果能够手动访问到那证明接口是没有任何问题的:
[root@master1 p8s-example]#curl http://10.244.0.8:9153/metrics
# HELP coredns_build_info A metric with a constant '1' value labeled by version, revision, and goversion from which CoreDNS was built.
# TYPE coredns_build_info gauge
coredns_build_info{goversion="go1.16.4",revision="053c4d5",version="1.8.4"} 1
# HELP coredns_cache_entries The number of elements in the cache.
# TYPE coredns_cache_entries gauge
coredns_cache_entries{server="dns://:53",type="denial"} 1
coredns_cache_entries{server="dns://:53",type="success"} 0
# HELP coredns_cache_misses_total The count of cache misses.
# TYPE coredns_cache_misses_total counter
……
我们可以看到可以正常访问到,从这里可以看到 CoreDNS 的监控数据接口是正常的了。
2.将CoreDns的/metrics接口配置到prometheus的ConfigMap
- 然后我们就可以将这个
/metrics接口配置到prometheus.yml中去了,直接加到默认的 prometheus 这个job下面:
注意:这里是直接加到上次实验环境里,将prometheus部署到k8s里的prometheus-cm.yamlconfigmap里。
csdn文章:https://blog.csdn.net/weixin_39246554/article/details/124498172?spm=1001.2014.3001.5501

[root@master1 ~]#cd p8s-example/
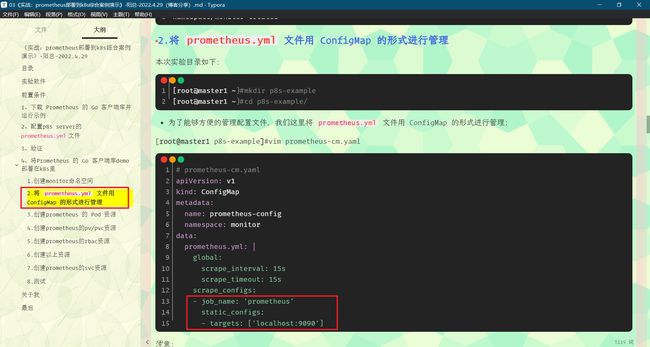
[root@master1 p8s-example]#vim prometheus-cm.yaml
# prometheus-cm.yaml
apiVersion: v1
kind: ConfigMap
metadata:
  name: prometheus-config
  namespace: monitor
data:
  prometheus.yml: |
    global:
      scrape_interval: 15s
      scrape_timeout: 15s

    scrape_configs:
    - job_name: 'prometheus'
      static_configs:
        - targets: ['localhost:9090']

    - job_name: 'coredns'
      static_configs:
        - targets: ['10.244.0.8:9153', '10.244.0.10:9153']
当然,我们这里只是一个很简单的配置,scrape_configs 下面可以支持很多参数,例如:
basic_auth和bearer_token:比如我们提供的/metrics接口需要 basic 认证的时候,通过传统的用户名/密码或者在请求的 header 中添加对应的 token 都可以支持kubernetes_sd_configs或consul_sd_configs:可以用来自动发现一些应用的监控数据
现在我们重新更新这个 ConfigMap 资源对象:
[root@master1 p8s-example]#kubectl apply -f prometheus-cm.yaml
configmap/prometheus-config configured
现在 Prometheus 的配置文件内容已经更改了,隔一会儿被挂载到 Pod 中的 prometheus.yml 文件也会更新。
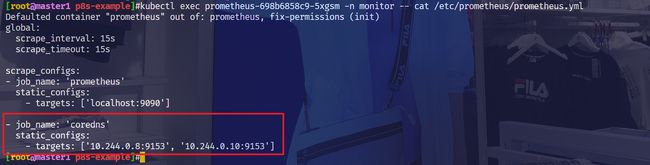
我们可以看下prometheus pd里面的数据是否已经发生了改变?
[root@master1 p8s-example]#kubectl exec prometheus-698b6858c9-5xgsm -n monitor -- cat /etc/prometheus/prometheus.yml

- 执行reload热更新操作
由于我们之前的 Prometheus 启动参数中添加了 --web.enable-lifecycle 参数,所以现在我们只需要执行一个 reload 命令即可让配置生效:

[root@master1 p8s-example]#kubectl get pods -n monitor -o wide
NAME                          READY   STATUS    RESTARTS   AGE   IP            NODE    NOMINATED NODE   READINESS GATES
prometheus-698b6858c9-5xgsm   1/1     Running   0          64m   10.244.1.86   node1   <none>           <none>
[root@master1 p8s-example]#curl -X POST "http://10.244.1.86:9090/-/reload"
[root@master1 p8s-example]#
热更新
由于 ConfigMap 通过 Volume 的形式挂载到 Pod 中去的热更新需要一定的间隔时间才会生效,所以需要稍微等一小会儿。
3.验证
- 这个时候我们再去看 Prometheus 的 Dashboard 中查看采集的目标数据:
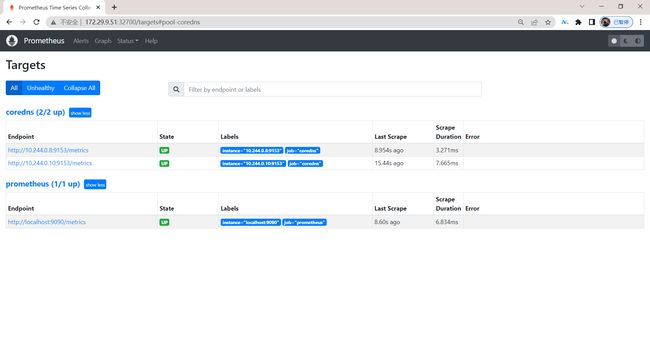
可以看到我们刚刚添加的 coredns 这个任务已经出现了。
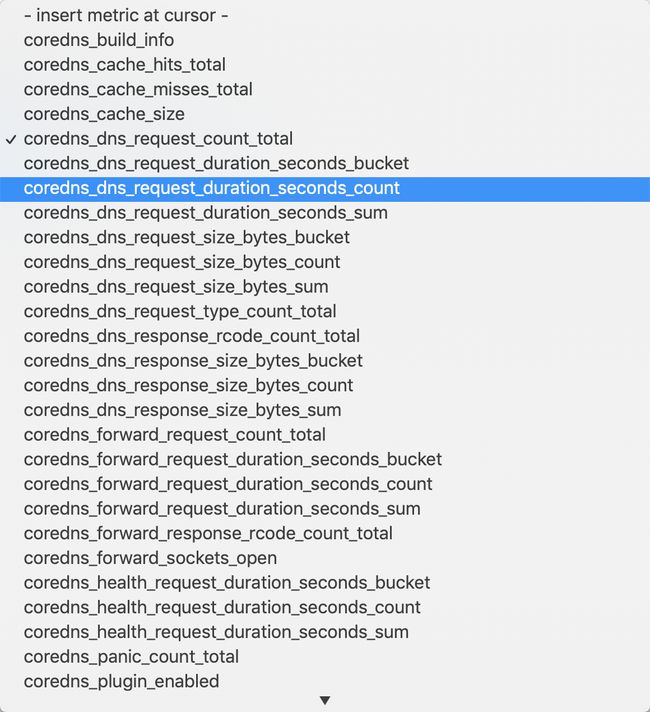
然后同样的我们可以切换到 Graph 下面去,我们可以找到一些 CoreDNS 的指标数据,至于这些指标数据代表什么意义,一般情况下,我们可以去查看对应的 /metrics 接口,里面一般情况下都会有对应的注释。
到这里我们就在 Prometheus 上配置了第一个 Kubernetes 应用。
测试结束。
2.使用 exporter 监控:监控k8s集群的redis应用
上面我们也说过有一些应用可能没有自带 /metrics 接口供 Prometheus 使用,在这种情况下,我们就需要利用 exporter 服务来为 Prometheus 提供指标数据了。Prometheus 官方为许多应用就提供了对应的 exporter 应用,也有许多第三方的实现,我们可以前往官方网站进行查看:exporters,当然如果你的应用本身也没有 exporter 实现,那么就要我们自己想办法去实现一个 /metrics 接口了,只要你能提供一个合法的 /metrics 接口,Prometheus 就可以监控你的应用。
1.创建pod资源
比如我们这里通过一个 redis-exporter 的服务来监控 redis 服务,对于这类应用,我们一般会以 sidecar 的形式和主应用部署在同一个 Pod 中,比如我们这里来部署一个 redis 应用,并用 redis-exporter 的方式来采集监控数据供 Prometheus 使用,如下资源清单文件:
[root@master1 ~]#cd p8s-example/
[root@master1 p8s-example]#vim prometheus-redis.yaml
# prometheus-redis.yaml
apiVersion: apps/v1
kind: Deployment
metadata:
  name: redis
  namespace: monitor
spec:
  selector:
    matchLabels:
      app: redis
  template:
    metadata:
      labels:
        app: redis
    spec:
      containers:
      - name: redis
        image: redis:4
        resources:
          requests:
            cpu: 100m
            memory: 100Mi
        ports:
        - containerPort: 6379
      - name: redis-exporter
        image: oliver006/redis_exporter:latest
        resources:
          requests:
            cpu: 100m
            memory: 100Mi
        ports:
        - containerPort: 9121
---
kind: Service
apiVersion: v1
metadata:
  name: redis
  namespace: monitor
spec:
  selector:
    app: redis
  ports:
  - name: redis
    port: 6379
    targetPort: 6379
  - name: prom
    port: 9121
    targetPort: 9121
可以看到上面我们在 redis 这个 Pod 中包含了两个容器,一个就是 redis 本身的主应用,另外一个容器就是 redis_exporter。
- 创建应用
现在直接创建上面的应用:
[root@master1 p8s-example]#kubectl apply -f prometheus-redis.yaml
deployment.apps/redis created
service/redis created
- 创建完成后,我们可以看到 redis 的 Pod 里面包含有两个容器:
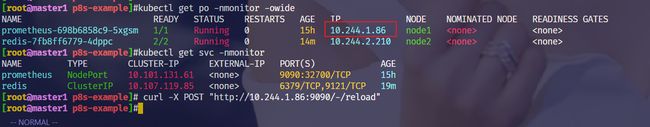
[root@master1 p8s-example]#kubectl get pods -n monitor
NAME                          READY   STATUS    RESTARTS   AGE
prometheus-698b6858c9-5xgsm   1/1     Running   0          13h
redis-7fb8ff6779-5ts8m        2/2     Running   0          48s

[root@master1 p8s-example]#kubectl get svc -n monitor
NAME         TYPE        CLUSTER-IP      EXTERNAL-IP   PORT(S)             AGE
prometheus   NodePort    10.101.131.61   <none>        9090:32700/TCP      13h
redis        ClusterIP   10.99.36.173    <none>        6379/TCP,9121/TCP   56s

- 我们可以通过 9121 端口来校验是否能够采集到数据:
➜ curl 10.99.36.173:9121/metrics
# HELP go_gc_duration_seconds A summary of the GC invocation durations.
# TYPE go_gc_duration_seconds summary
go_gc_duration_seconds{quantile="0"} 0
go_gc_duration_seconds{quantile="0.25"} 0
go_gc_duration_seconds{quantile="0.5"} 0
go_gc_duration_seconds{quantile="0.75"} 0
go_gc_duration_seconds{quantile="1"} 0
go_gc_duration_seconds_sum 0
go_gc_duration_seconds_count 0
......
# HELP redis_up Information about the Redis instance
# TYPE redis_up gauge
redis_up 1
# HELP redis_uptime_in_seconds uptime_in_seconds metric
# TYPE redis_uptime_in_seconds gauge
redis_uptime_in_seconds 100
2.更新Prometheus 的配置文件
- 同样的,现在我们只需要更新 Prometheus 的配置文件:
注意:这里同样在上次的prometheus的configmap文件里更新配置:
[root@master1 p8s-example]#pwd
/root/p8s-example
[root@master1 p8s-example]#vim prometheus-cm.yaml
# prometheus-cm.yaml
apiVersion: v1
kind: ConfigMap
metadata:
  name: prometheus-config
  namespace: monitor
data:
  prometheus.yml: |
    global:
      scrape_interval: 15s
      scrape_timeout: 15s

    scrape_configs:
    - job_name: 'prometheus'
      static_configs:
        - targets: ['localhost:9090']

    - job_name: 'coredns'
      static_configs:
        - targets: ['10.244.0.8:9153', '10.244.0.10:9153']

    - job_name: 'redis'
      static_configs:
        - targets: ['redis:9121']
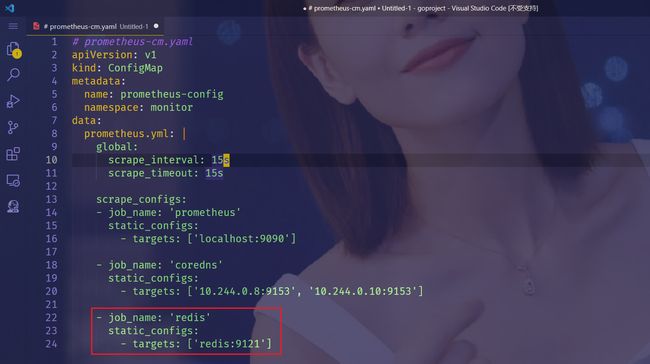
由于我们这里是通过 Service 去配置的 redis 服务,当然直接配置 Pod IP 也是可以的,因为和 Prometheus 处于同一个 namespace,所以我们直接使用 servicename 即可。
- 配置文件更新后,重新加载:
[root@master1 p8s-example]#kubectl apply -f prometheus-cm.yaml
configmap/prometheus-config configured

# 隔一会儿执行reload操作
[root@master1 p8s-example]# curl -X POST "http://10.244.1.86:9090/-/reload"
3.验证
- 这个时候我们再去看 Prometheus 的 Dashboard 中查看采集的目标数据:
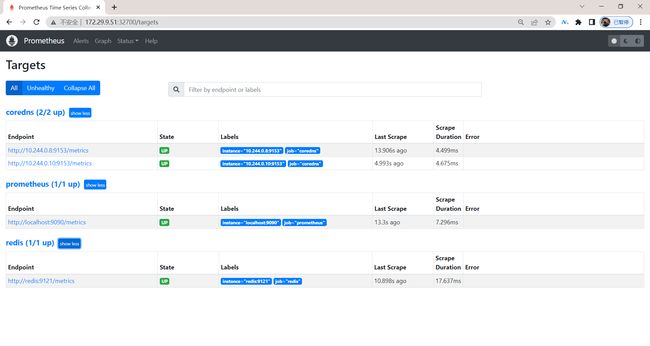
可以看到配置的 redis 这个 job 已经生效了。
切换到 Graph 下面可以看到很多关于 redis 的指标数据,我们选择任意一个指标,比如 redis_exporter_scrapes_total,然后点击执行就可以看到对应的数据图表了:
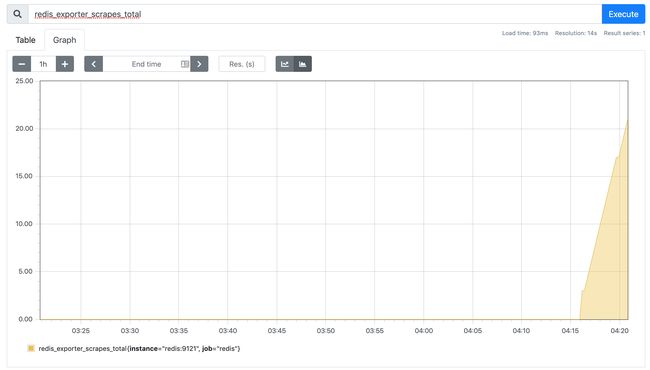
实验结束。
关于我
我的博客主旨:我希望每一个人拿着我的博客都可以做出实验现象,先把实验做出来,然后再结合理论知识更深层次去理解技术点,这样学习起来才有乐趣和动力。并且,我的博客内容步骤是很完整的,也分享源码和实验用到的软件,希望能和大家一起共同进步!
各位小伙伴在实际操作过程中如有什么疑问,可随时联系本人免费帮您解决问题:
-
个人微信二维码:x2675263825 (舍得), qq:2675263825。

-
个人微信公众号:《云原生架构师实战》

-
个人csdn
https://blog.csdn.net/weixin_39246554?spm=1010.2135.3001.5421

-
个人已开源干货
不服来怼:宇宙中最好用的云笔记 & 其他开源干货:https://www.yuque.com/go/doc/73723298?#


-
个人网站:(计划ing)
最后
好了,关于本次实验就到这里了,感谢大家阅读,最后贴上我女神的photo,祝大家生活快乐,每天都过的有意义哦,我们下期见!
 reOhV-1651363541082)]
-
个人已开源干货
不服来怼:宇宙中最好用的云笔记 & 其他开源干货:https://www.yuque.com/go/doc/73723298?#
[外链图片转存中…(img-ziprlHcL-1651363541083)]
[外链图片转存中…(img-s5S954Yk-1651363541083)]
-
个人网站:(计划ing)
最后
好了,关于本次实验就到这里了,感谢大家阅读,最后贴上我女神的photo,祝大家生活快乐,每天都过的有意义哦,我们下期见!