Python 机器学习7:sklearn 逻辑回归
1. 模型的保存与加载
Joblib可以将模型保存到磁盘,可以在必要时调用、重新运行。
import joblibjoblib.dump(estimator, "./test.pkl") 将模型保存为test.pkl
estimator = joblib.load("./test.pkl") 从test.pkl文件加载模型
estimator对象与原先训练好的模型相同。
2. 逻辑回归
from sklearn.linear_model import LogisticRegression
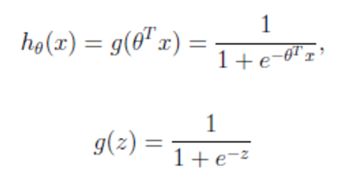
公式:
输出:[0,1]区间的概率值,默认0.5作为阀值;g(z)为sigmoid函数,将值映射到0~1之间。
sklearn.linear_model.LogisticRegression(penalty=‘l2’, C=1.0) L2正则化
返回值属性coef_:回归系数
例1:癌症种类预测案例
需求:通过威斯康星州乳腺肿瘤病例数据,分类为良性肿瘤和恶性肿瘤。
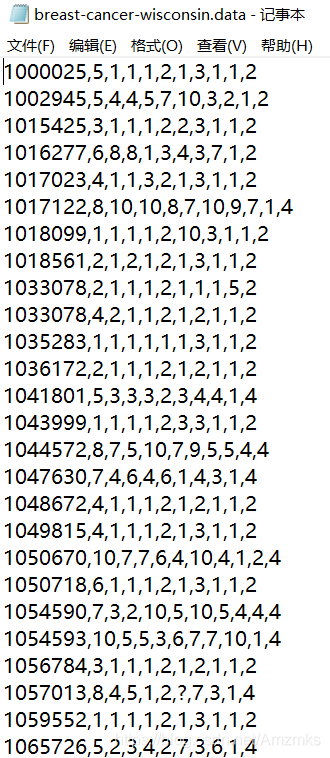
数据的第一列是用于检索的id,后9列分别是与肿瘤相关的医学特征,最后一列表示肿瘤类型的数值(2为良性,4为恶性)。
链接:https://pan.baidu.com/s/1MdaePnXiTSuN35mpkaH4lw
提取码:0sez
from sklearn.linear_model import LogisticRegression
from sklearn.model_selection import train_test_split
from sklearn.preprocessing import StandardScaler
from sklearn.metrics import classification_report
import pandas as pd
import numpy as np

# 构造列标签名字
column = ['Sample code number', 'Clump Thickness', 'Uniformity of Cell Size', 'Uniformity of Cell Shape',
          'Marginal Adhesion', 'Single Epithelial Cell Size', 'Bare Nuclei', 'Bland Chromatin', 'Normal Nucleoli',
          'Mitoses', 'Class']
# 读取数据
data = pd.read_csv("breast-cancer-wisconsin.data")
data.columns = column
# 缺失值进行处理
data = data.replace(to_replace='?', value=np.nan)
data = data.dropna()
# 进行数据的分割
x_train, x_test, y_train, y_test = train_test_split(data[column[1:10]], data[column[10]], test_size=0.25)
# 进行标准化处理
std = StandardScaler()
x_train = std.fit_transform(x_train)
x_test = std.transform(x_test)
# 逻辑回归预测
lg = LogisticRegression(C=1.0)
lg.fit(x_train, y_train)
print("回归系数:", lg.coef_)
y_predict = lg.predict(x_test)
print("准确率:", lg.score(x_test, y_test))
print("预测值:", y_predict)
print("召回率:", classification_report(y_test, y_predict, labels=[2, 4], target_names=["良性", "恶性"]))
输出:
回归系数: [[1.2219938 0.17390061 0.81603748 0.82438936 0.47774871 1.2899529
0.81146702 0.50990362 0.64696281]]
准确率: 0.9707602339181286
预测值: [2 2 4 4 2 2 4 4 2 4 2 2 4 2 4 2 4 2 4 2 2 2 2 4 4 4 2 2 2 2 2 2 2 2 2 2 4
2 4 4 2 2 2 4 4 4 4 2 4 4 2 2 2 2 2 2 4 2 4 2 2 2 2 2 2 2 2 2 2 2 4 2 2 2
2 4 2 2 4 4 4 4 2 4 4 4 2 2 4 2 2 4 2 4 4 2 4 4 2 2 2 2 4 4 4 2 4 4 2 2 2
4 4 4 2 2 4 2 4 2 2 2 4 2 4 2 4 2 4 2 2 4 2 2 2 4 4 2 2 4 2 4 4 2 2 2 2 4
2 4 4 4 2 4 4 2 2 2 2 2 2 4 2 4 2 2 2 2 2 2 2]
召回率: precision recall f1-score support良性 0.99 0.96 0.98 108
恶性 0.94 0.98 0.96 63accuracy 0.97 171
macro avg 0.96 0.97 0.97 171
weighted avg 0.97 0.97 0.97 171
逻辑回归的优点:适合需要得到一个分类概率的场景。
逻辑回归的缺点:当特征空间很大时,逻辑回归的性能不是很好。
3. ROC曲线 、AOC指标
TPR召回率:所有真实类别为1的样本中,预测类别为1的比例。
FPR:所有真实类别为0的样本中,预测类别为1的比例。
ROC曲线:横轴为FPR,纵轴为TPR,当二者相等时,对于不论真实类别是1还是0的样本,分类器预测为1的概率为相等的,此时AUC=0.5。
from sklearn.metrics import roc_auc_scoreAUC的概率意义是随机取一对正负样本,正样本得分大于负样本的概率。
AUC的最小值为0.5,最大值为1,取值越高越好。
roc_auc_score(y_true, y_score)
参数:
y_true:每个样本的真实类别,必须为0、1标记
y_score:预测的分
例2:计算上面案例的AUC值。
from sklearn.metrics import roc_auc_score

# 将y_test转换成0、1
y_true = np.where(y_test > 3, 1, 0)
print(roc_auc_score(y_true, y_predict))
输出:
0.9514751552795031


