利用机器学习进行房价预测
爬虫能做什么
爬虫除了能够获取互联网的数据以外还能够帮我们完成很多繁琐的手动操作,这些操作不仅仅包括获取数据,还能够添加数据,比如:
- 投票
- 管理多个平台的多个账户(如各个电商平台的账号)
- 微信聊天机器人
实际的应用远不止上面这些,但是上面的应用只是除开数据本身的应用而已,数据本身的应用也是很广的:
- 机器学习语料库
- 垂直领域的服务(二手车估值)
- 聚合服务(去哪儿网,美团)
- 新闻推荐(今日头条)
- 预测和判断(医疗领域)
所以爬虫能做的功能非常多,也就造就了爬虫的需求也是越来越旺盛,但是很多有过后端开发的人员却觉得爬虫很简单,很多人觉得爬虫用一个库(requests)去获取一个html然后解析就行了,实际上爬虫真的这么简单吗?
首先学习之前我们来问几个问题:
- 如果一个网页需要登录才能访问,怎么办?
- 对于上面的问题,很多人说模拟登录就行了,但实际上很多网站会采用各种手段去加大模拟登录的难度,如:各种验证码,登录逻辑的各种混淆和加密、参数的各种加密,这些问题都怎么解决?
- 很多网站只能手机登录怎么办?
- 很多网站为了用户体验和服务器优化,会将一个页面的各个元素采用异步加载或者js加载的方式完成?这些你有能力分析出来吗?
- 作为一个网站,各种反爬的方案也是层出不穷,当你的爬虫被反爬之后,你如何去猜测对方是怎么反爬的?
- 一个爬虫怎么发现最新的数据?如何发现一个数据是否被更新了?
如果你只是做一个简单的爬虫,比如你的爬虫就是一次性的,一次性获取某个网站的某些数据这样当然就简单了,但是你要做一个爬虫服务,你就必须要面对上面的问题,这上面还没有提到数据的提取和解析等等
爬虫之旅
- 新建本地html文件
首先新建打开pycharm新建static文件夹然后新建index.html
DOCTYPE html>
<html lang="en">
<head>
    <meta charset="UTF-8">
    <title>neuedutitle>
head>
<body>
<h1>欢迎来到王者峡谷h1>
<div id="container1" style="width: 500px; height: 500px; border: 1px solid red">
    <ul>
        <li class="red">鲁班七号li>
        <li>妲己li>
        <li>小乔li>
    ul>
    <ol>
        <li class="red">电玩小子li>
        <li>皮肤2li>
    ol>
div>
<div id="container2" class="red">
    <a href="http://www.neuedu.com">点击进入东软教育 <img src="http://contentcms-bj.cdn.bcebos.com/cmspic/99d4ddbcb9179b205a81f8919ef2f60c.jpeg?x-bce-process=image/crop,x_0,y_0,w_665,h_362" alt=""> a>
    <p>段落标签p>
div>
body>
html>
- 使用python读取本地html文件
with open(file='./static/index.html', mode='r', encoding='utf-8') as f:
    html_data = f.read()
print(html_data)
html_data变量中存放的就是html文件的所有源码
数据提取
获取了所有的HTML数据,接下来我们就要提取出来这些数据
非结构化的数据处理
文本、电话号码、邮箱地址
- 正则表达式
HTML 文件
- 正则表达式
- XPath
- CSS选择器
结构化的数据处理
JSON 文件
- JSON Path
- 转化成Python类型进行操作(json类)
XML 文件
- 转化成Python类型(xmltodict)
- XPath
- CSS选择器
- 正则表达式
有同学说,我正则用的不好,处理HTML文档很累,有没有其他的方法?
有!那就是XPath,我们可以先将 HTML文件 转换成 XML文档,然后用 XPath 查找 HTML 节点或元素。
使用xpath语法进行html的内容提取
XPath (XML Path Language) 是一门在 XML 文档中查找信息的语言,可用来在 XML 文档中对元素和属性进行遍历。
W3School官方文档:http://www.w3school.com.cn/xpath/index.asp
Xpath最常用语法:

其中 / 从根节点选取。 // 代表 从匹配选择的当前节点选择文档中的节点,而不考虑它们的位置
XPath的语法内容,在运用到Python抓取时要先转换为xml
lxml
xml 是 一个HTML/XML的解析器,主要的功能是如何解析和提取 HTML/XML 数据。
lxml和正则一样,也是用 C 实现的,是一款高性能的 Python HTML/XML 解析器,我们可以利用之前学习的XPath语法,来快速的定位特定元素以及节点信息。lxml python 官方文档:http://lxml.de/index.html需要安装C语言库,可使用 pip 安装:pip install lxml(或通过wheel方式安装)
from lxml import html, etree
# 读取到html文档

with open('index.html', mode='r', encoding='utf-8') as f:
    html_data = f.read()
    # print(html_data)
    # print(type(html_data))
    selectors = html.fromstring(html_data)
    h1 = selectors.xpath('/html/body/h1/text()')[0]
    print(h1)
    # //
    a = selectors.xpath('//div[@id="container2"]/a/text()')[0]
    link = selectors.xpath('//div[@id="container2"]/a/@href')[0]
    src = selectors.xpath('//div[@id="container2"]/a/img/@src')[0]
    print(a)
    print(link)
    print(src)

# 进行解析
Requests库的使用
虽然Python的标准库中 urllib 模块已经包含了平常我们使用的大多数功能,但是它的 API 使用起来让人感觉不太好,而 Requests 自称 “HTTP for Humans”,说明使用更简洁方便。
Requests 唯一的一个非转基因的 Python HTTP 库,人类可以安全享用:)
Requests 继承了urllib的所有特性。Requests支持HTTP连接保持和连接池,支持使用cookie保持会话,支持文件上传,支持自动确定响应内容的编码,支持国际化的 URL 和 POST 数据自动编码。
requests 的底层实现其实就是 urllib
Requests的文档非常完备,中文文档也相当不错。Requests能完全满足当前网络的需求,支持Python 2.6–3.5,而且能在PyPy下完美运行。
开源地址:https://github.com/kennethreitz/requests
中文文档 API: http://docs.python-requests.org/zh_CN/latest/index.html
- 安装方式: 利用 pip 安装
pip install requests
requests库的使用
import requests
headers = {"User-Agent": "Mozilla/5.0 (Macintosh; Intel Mac OS X 10_15_7) AppleWebKit/537.36 (KHTML, like Gecko) Chrome/99.0.4844.74 Safari/537.36"}
# url = 'http://www.baidu.com'
url = 'https://www.zhihu.com/signin?next=%2F'
response = requests.get(url, headers=headers)
print(response)
print(response.status_code) # 200
print(response.encoding) # 200
response.encoding = 'utf-8'
print(response.text) # 文本类型的响应

with open('baidu.html', mode='w', encoding='utf-8') as f:
    f.write(response.text)
实战房产数据爬取
import requests
import pandas as pd
from lxml import html
# 全部信息列表
count=list()
#生成1-10页url
def url_creat():
    #基础url
    url = 'https://qd.lianjia.com/ershoufang/pg{}/'
    #生成前10页url列表
    links=[url.format(i) for i in range(1,11)]
    return links

#对url进行解析
def url_parse(url):
    headers = {'User-Agent': 'Mozilla/5.0 (Windows NT 10.0; Win64; x64) AppleWebKit/537.36 (KHTML, like Gecko) Chrome/91.0.4472.164 Safari/537.36'}
    response=requests.get(url=url,headers=headers).text
    # etree=html.HTML(response)
    selectors=html.fromstring(response)
    #ul列表下的全部li标签
    li_List=selectors.xpath("//*[@class='sellListContent']/li")

    for li in li_List:
        #标题
        title=li.xpath('./div/div/a/text()')[0]
        #网址
        link=li.xpath('./div/div/a/@href')[0]
        #位置
        postion=li.xpath('./div/div[2]/div/a/text()')[0]+li.xpath('./div/div[2]/div/a[2]/text()')[0]
        #类型
        types=li.xpath('./div/div[3]/div/text()')[0].split(' | ')[0]
        #面积
        area=li.xpath('./div/div[3]/div/text()')[0].split(' | ')[1]
        #房屋信息
        info=li.xpath('./div/div[3]/div/text()')[0].split(' | ')[2:-1]
        info=''.join(info)
        #总价
        count_price=li.xpath('.//div/div[6]/div/span/text()')[0]+'万'
        #单价
        angle_price=li.xpath('.//div/div[6]/div[2]/span/text()')[0]
        dic={'标题':title,"位置":postion,'房屋类型':types,'面积':area,"单价":angle_price,'总价':count_price,'介绍':info,"网址":link}
        print(dic)
        #将房屋信息加入总列表中
        count.append(dic)
    data = pd.DataFrame(count)
    data.to_excel('房屋信息.xlsx', index=False)

for url in url_creat():
    url_parse(url)
常用科学计算库Numpy 和 Matplotlib
Matplotlib 是一个 Python 的 2D绘图库,它以各种硬拷贝格式和跨平台的交互式环境生成出版质量级别的图形。提供了一种有效的 MatLab 开源替代方案
机器学习前的准备
Numpy
NumPy系统是Python的一种开源的数值计算扩展。这种工具可用来存储和处理大型矩阵,比Python自身的嵌套列表(nested list structure)结构要高效的多(该结构也可以用来表示矩阵(matrix))
# 导包
import numpy as np
print(np.__version__)
# 大量应用于 矩阵和向量运算
# [1, 2, 3] + [1, 2, 3]
vec1 = np.array([i for i in range(10)], dtype=np.float32)
vec2 = np.array([i for i in range(10)])
print(vec1+vec2)
print(vec1.dot(vec2))
# 矩阵
np.random.seed(666)
matrix1 = np.random.randint(1, 100, (5, 7))
print(matrix1)

# np 支持下标和切片
print("-"*20)
print(vec1[2])
print(matrix1[0])
print(matrix1[1][1])
print(matrix1[3, 1])
print("-"*20)
print(vec1[5:])
print(matrix1[2:, 3:])
# np 属性
print("-"*20)
print(vec1.shape)
print(matrix1.shape)
print(vec1.ndim)
print(matrix1.ndim)
print(vec1.size)
print(matrix1.size)
print(vec1.dtype)
print(matrix1.dtype)
Matplotlib
Matplotlib 是一个 Python 的 2D绘图库,它以各种硬拷贝格式和跨平台的交互式环境生成出版质量级别的图形。提供了一种有效的 MatLab 开源替代方案
from matplotlib import pyplot as plt
import numpy as np
# 折线图
x1 = np.linspace(0, np.pi*2, num=100);
y1 = np.sin(x1)
plt.plot(x1, y1, color='g')
plt.plot(x1, np.cos(x1), color='r')
plt.xlabel('x axis')
plt.ylabel('y axis')
plt.grid()
plt.title("ML")
plt.show()

# 散点图
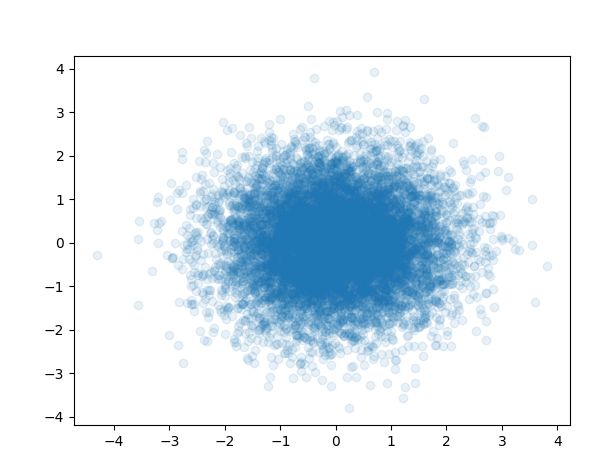
x2 = np.random.normal(0, 1, 10000)
y2 = np.random.normal(0, 1, 10000)
plt.scatter(x2, y2, alpha=0.1)
plt.show()
Pandas
pandas 是基于NumPy 的一种工具,该工具是为解决数据分析任务而创建的。Pandas 纳入了大量库和一些标准的数据模型,提供了高效地操作大型数据集所需的工具。pandas提供了大量能使我们快速便捷地处理数据的函数和方法。你很快就会发现,它是使Python成为强大而高效的数据分析环境的重要因素之一。
import pandas as pd
from matplotlib import pyplot as plt
import numpy as np
# df = pd.read_excel('沈阳房屋信息.xlsx',engine='openpyxl')
# print(df.head())
# [{}, {}]
s1 = pd.Series(np.random.randint(1, 10, 5), index=['a', 'b', 'c', 'd', 'e'])
print(s1)
df1 = pd.DataFrame(np.random.randint(1, 10, (3, 5)), index=['A', 'B','C'],
                   columns=['math', 'english', 'music', 'chinese', 'art'])
print(df1)
df1.to_csv('data.csv')


print(df1['math'])

print('-----')
print(df1.loc['A':'B', 'music':'art'])

print('-----')
print(df1.iloc[1:, :3])
df1.hist()
plt.show()
机器学习之KNN算法
什么是机器学习
- 定义: 机器学习是从数据中自动分析获得规律(模型),并利用规律对未知数据进行预测
- 通俗上讲:就是让机器去学习,让机器去执行
- 学习的目的是"减熵"(热力学第二定律:一个孤立的系统倾向于增加"熵")
机器学习的必要性
- 很多软件无法靠人工编程来解决,如:自动驾驶、计算机视觉、自然语言处理
比如说:鸢尾花的识别难以用人工编程(特性很多)
sklearn中提供了该数据集,主要内容有
150个样本数据
四个Attribute:
- sepal length in cm
- sepal width in cm
- petal length in cm
- petal width in cm
class:
数据
| 萼片长度 | 萼片宽度 | 花瓣长度 | 花瓣宽度 | 种类 |
|---|---|---|---|---|
| 5.1 | 3.5 | 1.4 | 0.2 | se(0) |
| 7.0 | 3.2 | 4.7 | 1.4 | ve(1) |
| 6.3 | 3.2 | 6 | 2.5 | vi(2) |
- 数据的整体叫做数据集(dataset)
- 每一行数据称作一个样本(sample)
- 每一列就是一个样本的特征(feature)
- 最后一列是标记(label)
前面的特征我们一般用X表示(矩阵),后面用y表示(向量)
每一行可以表示为特征向量
机器学习的基本任务
根据学习的任务模式 (训练数据是否有标签),机器学习可分为四大类:
- 有监督学习 (有标签)
- 无监督学习 (无标签)
- 半监督学习 (有部分标签)
- 增强学习 (有评级标签)
深度学习只是一种方法,而不是任务模式,因此与上面四类不属于同一个维度,但是深度学习与它们可以叠加成:深度有监督学习、深度非监督学习、深度半监督学习和深度增强学习。迁移学习也是一种方法,也可以分类为有监督迁移学习、非监督迁移学习、半监督迁移学习和增强迁移学习。
监督学习(分类和回归)
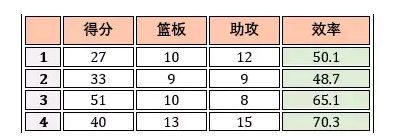
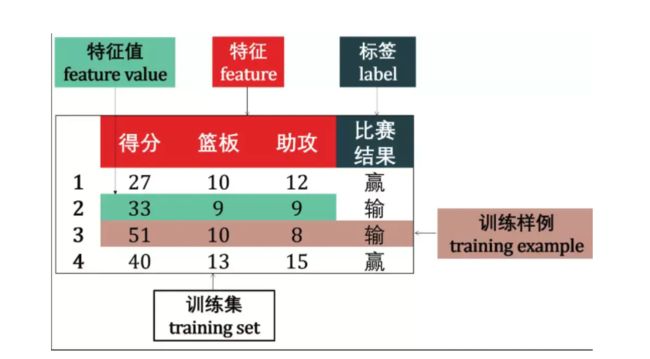
在监督学习中,数据 = (特征,标签),而其主要任务是分类和回归。以NBA球员詹姆斯的个人统计为例
分类
如果预测的是离散值 (discrete value),例如比赛结果赢或输,此类学习任务称为分类 (classification)。

如果预测的是连续值 (continuous value),例如詹姆斯效率 65.1, 70.3 等等,此类学习任务称为回归 (regression)。
回归(用于预测输入变量和输出变量之间的关系,输出是连续型的值)
结果是一个连续数字的值,而非类别
- 房价预测:面积,地点,卧室数量,房龄。。。。
- 股票的价格
- 市场分析(双十一某个店铺卖多少货 )
无监督学习
无监督学习 (unsupervised learning) 是找出输入数据的模式。比如,它可以根据电影的各种特征做聚类,用这种方法收集数据为电影推荐系统提供标签。此外无监督学习还可以降低数据的维度,它可以帮助我们更好的理解数据。
在无监督学习中,数据 = (特征,)。
除了根据詹姆斯个人统计来预测骑士队输赢或者个人效率值外,我们还可以对该数据做聚类 (clustering),即将训练集中的数据分成若干组,每组成为一个簇 (cluster)。

后来发现簇 A 代表赢,簇 B 代表输。聚类的用处就是可以找到一个潜在的原因来解释为什么样例 1 和 3 可以赢球。难道真的是只要詹姆斯三双就可以赢球?
线性回归算法简介
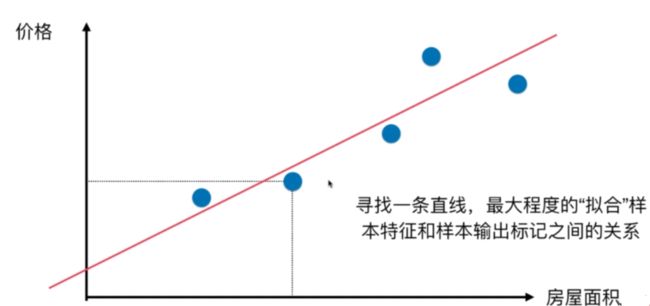
线性回归算法以一个坐标系里一个维度为结果,其他维度为特征(如二维平面坐标系中横轴为特征,纵轴为结果),无数的训练集放在坐标系中,发现他们是围绕着一条执行分布。线性回归算法的期望,就是寻找一条直线,最大程度的“拟合”样本特征和样本输出标记的关系
# 准备数据
import pandas as pd
from matplotlib import pyplot as plt
import numpy as np
df = pd.read_excel('沈阳房屋信息.xlsx',engine='openpyxl')
areas = df['面积'].values
prices = df['总价'].values
X_ls = []
for x in areas:
    res = float(x.replace('平米', ''))
    X_ls.append(res)
X_train = np.array(X_ls)
y_ls = []
for x in prices:
    res = float(x.replace('万', ''))
    y_ls.append(res)
X_train = np.array(X_ls)
y_train = np.array(y_ls)


# 进行机器学习
X_train = X_train.reshape(-1, 1)
print(X_train.shape)
print(y_train.shape)
from sklearn.linear_model import LinearRegression
slr = LinearRegression()
slr.fit(X_train, y_train)
print(slr.coef_)
print(slr.intercept_)


plt.scatter(X_train, y_train)
plt.plot(np.linspace(0,300), np.linspace(0,300)*slr.coef_[0] + slr.intercept_, color='r')
plt.show()
综合实战沈阳二手房价预测
# 准备数据
import pandas as pd
from matplotlib import pyplot as plt
import numpy as np
df = pd.read_excel('沈阳房屋信息.xlsx',engine='openpyxl')
areas = df['面积'].values
prices = df['总价'].values
house_type = df['房屋类型'].values
X_ls = []
for x in areas:
    res = float(x.replace('平米', ''))
    X_ls.append(res)
X_ls1 = []
for x in house_type:
    a, b = x.split('室')
    b = int(b.replace('厅', ''))
    a = int(a)
    X_ls1.append(a+b)
X = np.hstack([np.array(X_ls).reshape(-1, 1), np.array(X_ls1).reshape(-1, 1)])

y_ls = []
for x in prices:
    res = float(x.replace('万', ''))
    y_ls.append(res)
y = np.array(y_ls)

# 数据分割
from sklearn.model_selection import train_test_split
X_train, X_test, y_train, y_test = train_test_split( X, y, test_size=0.33, random_state=666)
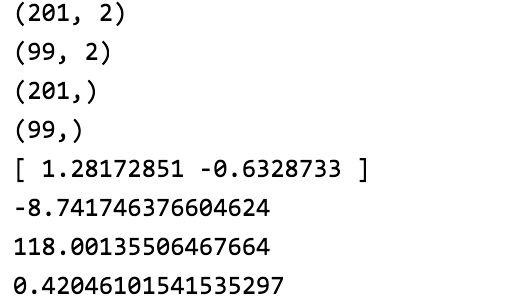
print(X_train.shape)
print(X_test.shape)
print(y_train.shape)
print(y_test.shape)
# # 进行机器学习

from sklearn.linear_model import LinearRegression
slr = LinearRegression()
slr.fit(X_train, y_train)
print(slr.coef_)
print(slr.intercept_)

y_pred = slr.predict(X_test)
# print(y_pred)

# 模型评价
# mse
from sklearn.metrics import mean_squared_error
print(mean_squared_error(y_test, y_pred)/len(y_test))
# r2score
print(slr.score(X_test, y_test))

