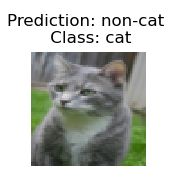
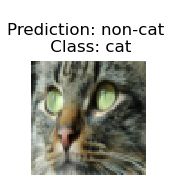
【深度学习】吴恩达深度学习-Course1神经网络与深度学习-第四周深度神经网络的关键概念编程(下)——深度神经网络用于图像分类:应用
在阅读这篇文章之前,请您先阅读:【深度学习】吴恩达深度学习-Course1神经网络与深度学习-第四周深度神经网络的关键概念编程(上)——一步步建立深度神经网络,这篇文章是本篇文章的前篇,没有前篇的基础,您很难完成本篇文章的任务。
视频链接:【中英字幕】吴恩达深度学习课程第一课 — 神经网络与深度学习
学习链接:
- 【中文】【吴恩达课后编程作业】Course 1 - 神经网络和深度学习 - 第四周作业(1&2)
- Deep Neural Network for Image Classification: Application
目录
- 〇、作业目标
- 一、一些必要的包
- 二、数据集
-
- 1.初探数据集
- 2.数据集的更多信息
- 3.重塑和标准化数据集
- 三、模型的体系结构
-
- 1.两层神经网络
- 2.L层深度神经网络
- 3.通用方法
- 四、两层神经网络模型
- 五、L层神经网络
- 六、预测结果分析
- 七、测试你自己的图片(选做)
- 八、总代码
〇、作业目标
当你结束这篇练习,你将结束第四周的最后一个编程任务,同时也是course1的最后一个编程任务。
在这次任务中,你将使用你前面完善的函数来建立一个深度神经网络,并且将它应用于图像分类——猫的识别中。你将看到比之前逻辑回归更为精确的结果。
在这次任务之后你将能够:
- 建立一个深度神经网络来进行监督学习。
一、一些必要的包
让我们先导入此次任务所需要的包
- numpy:科学计算包
- matplotlib:绘图的Python库
- h5py:与存储在H5文件上的数据集交互的通用包。
- 这里使用PIL和scipy测试您的模型,最后使用您自己的图片。
- dnn_app_utils是你在上一个任务中完善的函数:【深度学习】吴恩达深度学习-Course1神经网络与深度学习-第四周深度神经网络的关键概念编程(上)——一步步建立深度神经网络
- np.random.seed(1)是用来保持我们生成随机数一致的。
您可以在pyCharm中粘贴以下代码看看所需要的包是否已经到位(dnn_app_utils是你上次作业的.py文件路径)
import numpy as np
import h5py
import matplotlib.pyplot as plt
import scipy
from PIL import Image
from scipy import ndimage
from dnn_app_utils import *

plt.rcParams['figure.figsize'] = (5.0, 4.0) # set default size of plots
plt.rcParams['image.interpolation'] = 'nearest'
plt.rcParams['image.cmap'] = 'gray'

np.random.seed(1)
二、数据集
你将使用和在逻辑回归中同样的“猫或非猫”数据集(第二周任务中的数据集)。在那时,你建立的模型对于测试数据集而言有70%的精确度来区分猫或非猫。你会在这里做的更好!
问题陈述:你有一个数据集(“data.h5”)包括如下内容:
- 有m_train张图片的训练数据集,他们被标记了猫(1)或非猫(0)
- 有m_test张图片的猫或非猫的测试数据集
- 每一张图片的维度是(num_px, num_px, 3),这里的3是3个通道(RGB颜色通道)。
1.初探数据集
让我们进一步熟悉这个数据集。加载接下来的这段代码(注意,在这之前,请将上一个任务百度网盘中的Ir_utils导入到你的代码中:import lr_utils import load_dataset):
train_x_orig, train_y, test_x_orig, test_y, classes = load_dataset()

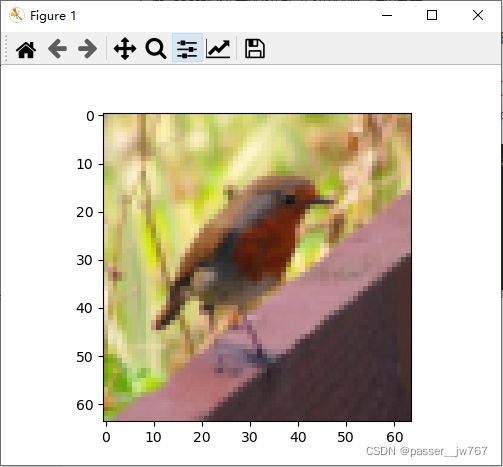
index = 10
plt.imshow(train_x_orig[index])
plt.show()
print ("y = " + str(train_y[0, index]) + ". It's a " + classes[train_y[0, index]].decode("utf-8") + " picture.")
y = 0. It's a non-cat picture.
说明这并不是一张猫图。
2.数据集的更多信息
让我们更详细地看数据集,你可以复制粘贴下边的代码:
m_train = train_x_orig.shape[0]
num_px = train_x_orig.shape[1]
m_test = test_x_orig.shape[0]

print ("Number of training examples: " + str(m_train))
print ("Number of testing examples: " + str(m_test))
print ("Each image is of size: (" + str(num_px) + ", " + str(num_px) + ", 3)")
print ("train_x_orig shape: " + str(train_x_orig.shape))
print ("train_y shape: " + str(train_y.shape))
print ("test_x_orig shape: " + str(test_x_orig.shape))
print ("test_y shape: " + str(test_y.shape))
得到的结果如下:
Number of training examples: 209
Number of testing examples: 50
Each image is of size: (64, 64, 3)
train_x_orig shape: (209, 64, 64, 3)
train_y shape: (1, 209)
test_x_orig shape: (50, 64, 64, 3)
test_y shape: (1, 50)
3.重塑和标准化数据集
这一步在第二周的编程作业中就出现过。见【深度学习】吴恩达深度学习-Course1神经网络与深度学习-第二周神经网络基础编程中的第四大点中查看并处理数据集的第三步降维
通常,在将图像送到神经网络之前,您可以对其进行重塑和标准化,代码将在下边给出。
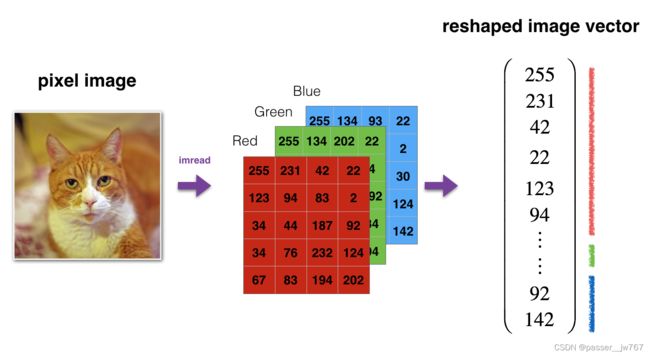
(本图片表示:将图片转换为向量信息)
# Reshape the training and test examples
train_x_flatten = train_x_orig.reshape(train_x_orig.shape[0], -1).T   # The "-1" makes reshape flatten the remaining dimensions
test_x_flatten = test_x_orig.reshape(test_x_orig.shape[0], -1).T

# Standardize data to have feature values between 0 and 1.
train_x = train_x_flatten / 255.
test_x = test_x_flatten / 255.

print ("train_x's shape: " + str(train_x.shape))
print ("test_x's shape: " + str(test_x.shape))
结果如下:
train_x's shape: (12288, 209)
test_x's shape: (12288, 50)
这里的12288等同于 64 * 64 * 3,是将图片重塑为了一个向量。
三、模型的体系结构
现在你应该对这个数据集比较亲切了,是时候建立一个深度神经网络来辨别猫/非猫了。
你将建立两个不一样的模型:
- 一个两层的神经网络
- 一个L层的深度神经网络
你将会比较这两个模型不同的表现,同时尝试不同的层数(不同的L值)
1.两层神经网络
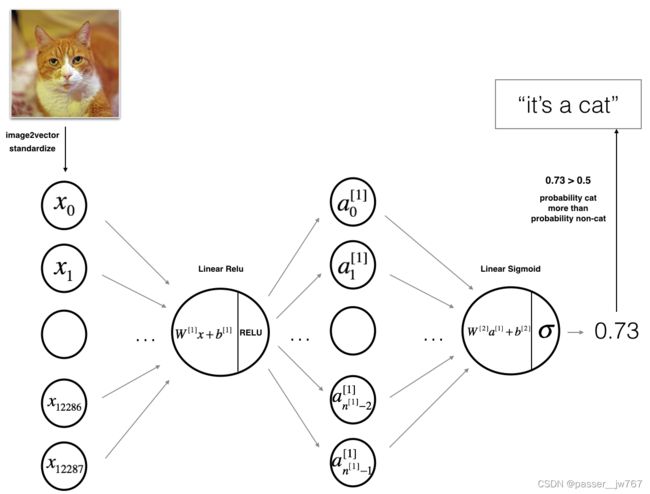
如上图所示,模型可以被概括为:输入->线性传播->RELU激活->线性传播->SIGMOID激活->输出。
有一些要点如下:
-
输入是一个(64,64,3)的图像,它被展平为一个(12288,1)大小的向量;
-
将这个向量乘以维度为(n^ [1],12288)的权重矩阵W^ [1];(n^ [1]是第一层的神经网络单元数)
-
根据这个得到的向量,乘上权重矩阵W^ [2]并加上你的偏差向量;
-
使用SIGMOID激活后你将得到结果,如果这个结果大于0.5,你就将此图分类为猫图。
2.L层深度神经网络
很难通过上边我们提及的步骤来表示L层深度神经网络。然而,这里有一个更为简单的说法。
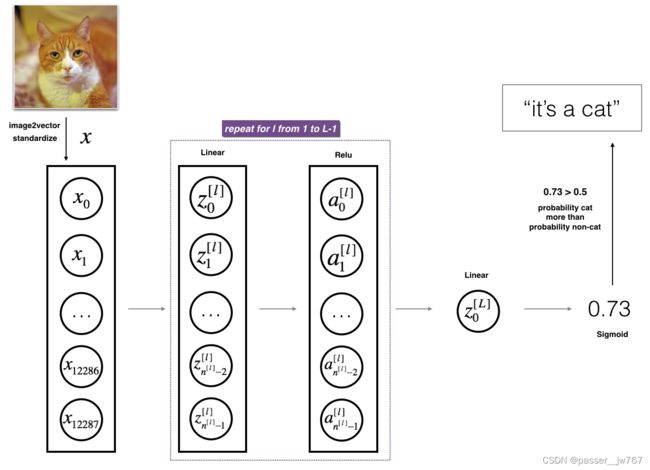
这个模型可以被概括为:【Lineaer->ReLU】×(L-1) -> Linear -> Sigmoid
一些要点如下:
- 输入是一个(64,64,3)的图像,它被展平为一个(12288,1)大小的向量;
- 将上边得到的向量与权重矩阵W^ [1]相乘,然后加上偏差矩阵b^ [1],结果就叫线性单元;
- 接下来,你将在上边的线性单元中使用ReLU激活。这个过程可以对不同的(W^ [l], b^ [l])重复很多次,这取决于你模型的结构;
- 最后,你对最后一个线性单元使用Sigmoid激活。如果结果大于0.5,就可分类为一个猫图。
3.通用方法
如往常一样,你将通过以下步骤建立起模型:
- 初始化参数/定义超参数;
- 循环num_iteration次以下的操作:
a. 前向传播
b. 计算损失
c. 反向传播
d. 更新参数(使用参数和反向传播获得的梯度) - 使用训练的参数来预测结果
现在,让我们建立这两个模型吧。
四、两层神经网络模型
问题:使用你在前一个任务中完成的帮助函数来建立一个两层神经网络模型。这个模型的结构如下:LINEAR -> RELU -> LINEAR -> SIGMOID。你可能需要的功能的和它们的输入如下:
def initialize_parameters(n_x, n_h, n_y):
    ...
    return parameters
def linear_activation_forward(A_prev, W, b, activation):
    ...
    return A, cache
def compute_cost(AL, Y):
    ...
    return cost
def linear_activation_backward(dA, cache, activation):
    ...
    return dA_prev, dW, db
def update_parameters(parameters, grads, learning_rate):
    ...
    return parameters
根据你所学内容以及三、四大点中的提示,完成函数def two_layer_model(X, Y, layers_dims, learning_rate=0.0075, num_iterations=3000, print_cost=False),其中:
- X:输入数据,维度是(n_x, 数据集数量)
- Y:真正的标签向量(1为猫,0为非猫),维度是(1, 数据集数量)
- layer_dims:所有层的维度,这里是(n_x, n_h, n_y)
- num_iterations:循环迭代的次数
- learning_rate:梯度下降更新规则的学习率
- print_cost:如果为True,则每100次迭代打印一次成本
该函数要求你输出parameters,这是包含W1,W2,b1,b2的Python字典类型。
我们规定layers_dims如下:
# 一些常数指定
n_x = 12288 #输入特征为64*64*3
n_h = 7
n_y = 1
# 两层神经网络模型
def two_layer_model(X, Y, layers_dims, learning_rate=0.0075, num_iterations=3000, print_cost=False):
    np.random.seed(1)

    costs = []
    grads = {}
    n_x, n_h, n_y = layers_dims

    parameters = initialize_parameters(n_x, n_h, n_y)

    W1 = parameters["W1"]
    b1 = parameters["b1"]
    W2 = parameters["W2"]
    b2 = parameters["b2"]

    for i in range(0, num_iterations):

        # 前向传播
        A1, cache1 = linear_activation_forward(X, W1, b1, "relu")
        A2, cache2 = linear_activation_forward(A1, W2, b2, "sigmoid")

        # 计算损失
        cost = compute_cost(A2, Y)

        # 初始化反向传播
        dA2 = - (np.divide(Y, A2) - np.divide(1 - Y, 1 - A2))

        # 反向传播
        dA1, dW2, db2 = linear_activation_backward(dA2, cache2, "sigmoid")
        dA0, dW1, db1 = linear_activation_backward(dA1, cache1, "relu")

        grads['dW1'] = dW1
        grads['db1'] = db1
        grads['dW2'] = dW2
        grads['db2'] = db2

        parameters = update_parameters(parameters, grads, learning_rate)

        W1 = parameters["W1"]
        b1 = parameters["b1"]
        W2 = parameters["W2"]
        b2 = parameters["b2"]

        if i % 100 == 0:
            costs.append(cost)
            if print_cost:
                print("Cost after iteration {}: {}".format(i, np.squeeze(cost)))

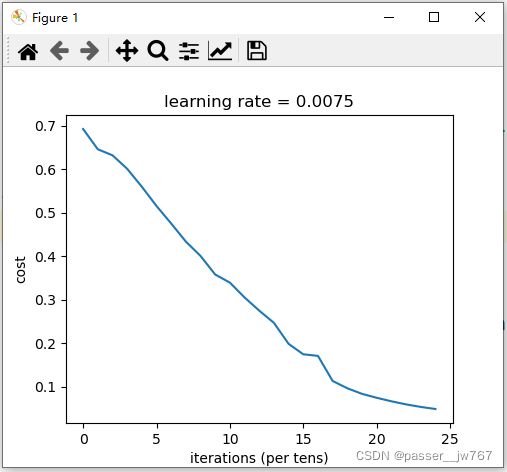
    # 绘图
    plt.plot(np.squeeze(costs))
    plt.ylabel('cost')
    plt.xlabel('iterations (per tens)')
    plt.title("learning rate = " + str(learning_rate))
    plt.show()

    return parameters
最重要的步骤还是for循环里的步骤:前向传播 -> 初始化反向传播的参数 -> 反向传播 -> 更新参数 ->记录参数 -> 记录成本。
跑下面这行代码来检验一下你的函数是否正确吧~:
parameters = two_layer_model(train_x, train_y, layers_dims = (n_x, n_h, n_y), num_iterations = 2500, print_cost=True)
Cost after iteration 0: 0.693049735659989
Cost after iteration 100: 0.6464320953428849
Cost after iteration 200: 0.6325140647912677
Cost after iteration 300: 0.6015024920354665
Cost after iteration 400: 0.5601966311605747
Cost after iteration 500: 0.5158304772764729
Cost after iteration 600: 0.47549013139433266
Cost after iteration 700: 0.4339163151225749
Cost after iteration 800: 0.40079775362038905
Cost after iteration 900: 0.3580705011323798
Cost after iteration 1000: 0.33942815383664116
Cost after iteration 1100: 0.3052753636196264
Cost after iteration 1200: 0.2749137728213021
Cost after iteration 1300: 0.2468176821061484
Cost after iteration 1400: 0.1985073503746608
Cost after iteration 1500: 0.17448318112556635
Cost after iteration 1600: 0.17080762978096098
Cost after iteration 1700: 0.11306524562164728
Cost after iteration 1800: 0.09629426845937152
Cost after iteration 1900: 0.08342617959726856
Cost after iteration 2000: 0.0743907870431908
Cost after iteration 2100: 0.06630748132267926
Cost after iteration 2200: 0.05919329501038164
Cost after iteration 2300: 0.0533614034856055
Cost after iteration 2400: 0.04855478562877015
还好我们使用向量化实现的,否则可能将花费这10倍的时间。
现在,你可以使用训练的参数来分类数据集中的图像了,看一看你在训练和测试集上的预测结果吧。
请你参照之前所学的内容完成预测函数 def predict(X, Y, parameters),其中:
- X为输入的数据
- Y为真实的标签
- parameters是你经过学习后得到的参数
def predict(X, y, parameters):

    m = X.shape[1]
    n = len(parameters) // 2  # 神经网络的层数
    p = np.zeros((1, m))

    # 根据参数前向传播
    probas, caches = L_model_forward(X, parameters)

    for i in range(0, probas.shape[1]):
        if probas[0, i] > 0.5:
            p[0, i] = 1
        else:
            p[0, i] = 0

    print("准确度为: " + str(float(np.sum((p == y)) / m)))

    return p
调用函数进行预测:
# 预测
prediction_train = predict(train_x, train_y, parameters)
prediction_test = predict(test_x, test_y, parameters)
结果为:
准确度为:1.0
准确度为:0.72
由此可知,训练集准确度为1,测试集合准确度为0.72。
五、L层神经网络
问题:使用你在前一个任务中完成的帮助函数来建立一个L层神经网络模型。这个模型的结构如下:【LINAER -> RELU】× (L-1) -> LINEAR ->SIGMOIDA。你可能需要的功能的和它们的输入如下:
def initialize_parameters_deep(layer_dims):
    ...
    return parameters
def L_model_forward(X, parameters):
    ...
    return AL, caches
def compute_cost(AL, Y):
    ...
    return cost
def L_model_backward(AL, Y, caches):
    ...
    return grads
def update_parameters(parameters, grads, learning_rate):
    ...
    return parameters
同时我们规定layers_dims如下:
### CONSTANTS ###
layers_dims = [12288, 20, 7, 5, 1] #  5-layer model
请你完善建立L层神经网络的函数def L_layer_model(X, Y, layers_dims, learning_rate=0.0075, num_iterations=3000, print_cost=False)
这里的参数与二层神经网络中的参数是一样的。
# L层神经网络模型
def L_layer_model(X, Y, layers_dims, learning_rate=0.0075, num_iterations=3000, print_cost=False):
    np.random.seed(1)

    costs = []

    parameters = initialize_parameters_deep(layers_dims)

    for i in range(0, num_iterations):
        AL, caches = L_model_forward(X, parameters)

        cost = compute_cost(AL, Y)

        grads = L_model_backward(AL, Y, caches)

        parameters = update_parameters(parameters, grads, learning_rate)

        if print_cost and i % 100 == 0:
            print("Cost after iteration %i: %f" % (i, cost))
        if print_cost and i % 100 == 0:
            costs.append(cost)

    # 绘图
    plt.plot(np.squeeze(costs))
    plt.ylabel('cost')
    plt.xlabel('iterations (per tens)')
    plt.title("Learning rate =" + str(learning_rate))
    plt.show()

    return parameters
得到的结果如下:(如果你得到的结果学习率始终保持在0.64,请往下看解决方法)
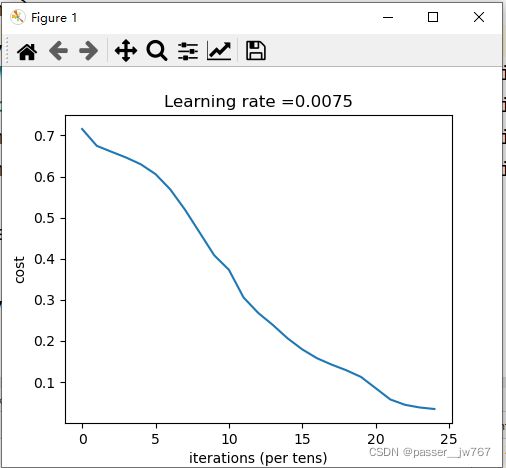
Cost after iteration 0: 0.715732
Cost after iteration 100: 0.674738
Cost after iteration 200: 0.660337
Cost after iteration 300: 0.646289
Cost after iteration 400: 0.629813
Cost after iteration 500: 0.606006
Cost after iteration 600: 0.569004
Cost after iteration 700: 0.519797
Cost after iteration 800: 0.464157
Cost after iteration 900: 0.408420
Cost after iteration 1000: 0.373155
Cost after iteration 1100: 0.305724
Cost after iteration 1200: 0.268102
Cost after iteration 1300: 0.238725
Cost after iteration 1400: 0.206323
Cost after iteration 1500: 0.179439
Cost after iteration 1600: 0.157987
Cost after iteration 1700: 0.142404
Cost after iteration 1800: 0.128652
Cost after iteration 1900: 0.112443
Cost after iteration 2000: 0.085056
Cost after iteration 2100: 0.057584
Cost after iteration 2200: 0.044568
Cost after iteration 2300: 0.038083
Cost after iteration 2400: 0.034411
对于学习率卡在0.64的问题,我参考了学习链接1的评论区,你可以这么更改:
修改上一篇你完成的代码的“initialize_parameters_deep()方法:
将这一句
parameters["W" + str(i)] = np.random.randn(layer_dims[i], layer_dims[i - 1]) * 0.01
改成下边的
parameters["W" + str(i)] = np.random.randn(layer_dims[i], layer_dims[i - 1]) / np.sqrt(layer_dims[i - 1])
你便会得到与我一样的结果。
再利用下边的代码进行预测:
prediction_train = predict(train_x, train_y, parameters)
prediction_test = predict(test_x, test_y, parameters)
我得到的结果是:
准确度为:0.9952153110047847
准确度为:0.78
很不错!似乎通过5层的神经网络模型,我们的准确率已经提高到了78%。这是一个不错的表现。
在之后的课程“改善深度神经网络”中,你将系统地学习怎么获得更好的超参数(学习速率、每一层的单元数,迭代的次数以及其他你将学习到的参数)从而获取更高的精度。
六、预测结果分析
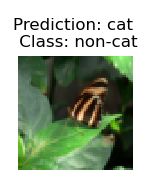
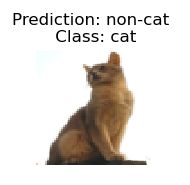
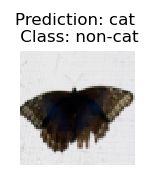
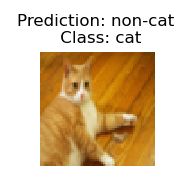
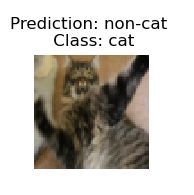
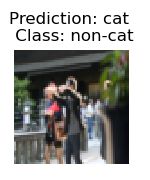
首先,我们先看一下L层模型标记不正确的一些图像。你可以复制以下代码,以得到标记错误的图像:
# 绘制错误图像
def print_mislabeled_images(classes, X, y, p):
    """
	绘制预测和实际不同的图像。
	    X - 数据集
	    y - 实际的标签
	    p - 预测
    """
    a = p + y
    mislabeled_indices = np.asarray(np.where(a == 1))
    plt.rcParams['figure.figsize'] = (40.0, 40.0)  # set default size of plots
    num_images = len(mislabeled_indices[0])
    for i in range(num_images):
        index = mislabeled_indices[1][i]

        plt.subplot(2, num_images, i + 1)
        plt.imshow(X[:, index].reshape(64, 64, 3), interpolation='nearest')
        plt.axis('off')
        plt.title(
            "Prediction: " + classes[int(p[0, index])].decode("utf-8") + " \n Class: " + classes[y[0, index]].decode(
                "utf-8"))


# 这里的prediction_test是上边预测出来的结果
print_mislabeled_images(classes, test_x, test_y, prediction_test)
这些类型的图片主要是在以下的方面存在缺陷:
- 猫的身体位置与正常情况下稍有区别
- 猫的颜色与背景颜色相近
- 猫的颜色和种类比较特殊
- 相机角度问题
- 图片的明暗程度
- 位置变化(猫在图片中太小或太大)
七、测试你自己的图片(选做)
恭喜你完成此次任务。你可以使用你自己的图片来测试模型的输出。像下边这么做:
- 将你想测试的图片放在与本任务相同的文件夹下
- 修改下边代码中图片名为你的图片名
- 运行代码,观察最终结果是否正确
num_px = 64
my_label_y = [1] # the true class of your image (1 -> cat, 0 -> non-cat)
#读取--转三通道RGB(如果本身是三通道可以移除)--变换像素64*64
image = np.array(Image.open('catvsnoncat.jpg').convert("RGB").resize((num_px, num_px)))
predit_image = image.reshape((num_px*num_px*3,1))
my_predicted_image = predict(predit_image, my_label_y, parameters)
plt.imshow(image)
print ("y = " + str(np.squeeze(my_predicted_image)) + ", your L-layer model predicts a \"" + classes[int(np.squeeze(my_predicted_image)),].decode("utf-8") +  "\" picture.")
得到的结果是:
y = 1.0, your L-layer model predicts a "cat" picture.
八、总代码
import time
import numpy as np
import h5py
import matplotlib.pyplot as plt
import scipy
from PIL import Image
from scipy import ndimage
from course1.week4.main import *
from course1.week4.lr_utils import load_dataset

plt.rcParams['figure.figsize'] = (5.0, 4.0) # set default size of plots
plt.rcParams['image.interpolation'] = 'nearest'
plt.rcParams['image.cmap'] = 'gray'

np.random.seed(1)

# 初探数据集
train_x_orig, train_y, test_x_orig, test_y, classes = load_dataset()

# index = 10
# plt.imshow(train_x_orig[index])
# plt.show()
# print ("y = " + str(train_y[0, index]) + ". It's a " + classes[train_y[0, index]].decode("utf-8") + " picture.")

# 更详细地看数据集
# m_train = train_x_orig.shape[0]
# num_px = train_x_orig.shape[1]
# m_test = test_x_orig.shape[0]
#
# print ("Number of training examples: " + str(m_train))
# print ("Number of testing examples: " + str(m_test))
# print ("Each image is of size: (" + str(num_px) + ", " + str(num_px) + ", 3)")
# print ("train_x_orig shape: " + str(train_x_orig.shape))
# print ("train_y shape: " + str(train_y.shape))
# print ("test_x_orig shape: " + str(test_x_orig.shape))
# print ("test_y shape: " + str(test_y.shape))

#
# Reshape the training and test examples
train_x_flatten = train_x_orig.reshape(train_x_orig.shape[0], -1).T   # The "-1" makes reshape flatten the remaining dimensions
test_x_flatten = test_x_orig.reshape(test_x_orig.shape[0], -1).T

# Standardize data to have feature values between 0 and 1.
train_x = train_x_flatten / 255.
test_x = test_x_flatten / 255.

# print ("train_x's shape: " + str(train_x.shape))
# print ("test_x's shape: " + str(test_x.shape))

# 两层神经网络模型
def two_layer_model(X, Y, layers_dims, learning_rate=0.0075, num_iterations=3000, print_cost=False):
    np.random.seed(1)

    costs = []
    grads = {}
    n_x, n_h, n_y = layers_dims

    parameters = initialize_parameters(n_x, n_h, n_y)

    W1 = parameters["W1"]
    b1 = parameters["b1"]
    W2 = parameters["W2"]
    b2 = parameters["b2"]

    for i in range(0, num_iterations):

        # 前向传播
        A1, cache1 = linear_activation_forward(X, W1, b1, "relu")
        A2, cache2 = linear_activation_forward(A1, W2, b2, "sigmoid")

        # 计算损失
        cost = compute_cost(A2, Y)

        # 初始化反向传播
        dA2 = - (np.divide(Y, A2) - np.divide(1 - Y, 1 - A2))

        # 反向传播
        dA1, dW2, db2 = linear_activation_backward(dA2, cache2, "sigmoid")
        dA0, dW1, db1 = linear_activation_backward(dA1, cache1, "relu")

        grads['dW1'] = dW1
        grads['db1'] = db1
        grads['dW2'] = dW2
        grads['db2'] = db2

        parameters = update_parameters(parameters, grads, learning_rate)

        W1 = parameters["W1"]
        b1 = parameters["b1"]
        W2 = parameters["W2"]
        b2 = parameters["b2"]

        if i % 100 == 0:
            costs.append(cost)
            if print_cost:
                print("Cost after iteration {}: {}".format(i, np.squeeze(cost)))

    # 绘图
    plt.plot(np.squeeze(costs))
    plt.ylabel('cost')
    plt.xlabel('iterations (per tens)')
    plt.title("learning rate = " + str(learning_rate))
    plt.show()

    return parameters


# L层神经网络模型
def L_layer_model(X, Y, layers_dims, learning_rate=0.0075, num_iterations=3000, print_cost=False):
    np.random.seed(1)

    costs = []

    parameters = initialize_parameters_deep(layers_dims)

    for i in range(0, num_iterations):
        AL, caches = L_model_forward(X, parameters)

        cost = compute_cost(AL, Y)

        grads = L_model_backward(AL, Y, caches)

        parameters = update_parameters(parameters, grads, learning_rate)

        if print_cost and i % 100 == 0:
            print("Cost after iteration %i: %f" % (i, cost))
        if print_cost and i % 100 == 0:
            costs.append(cost)

    # 绘图
    plt.plot(np.squeeze(costs))
    plt.ylabel('cost')
    plt.xlabel('iterations (per tens)')
    plt.title("Learning rate =" + str(learning_rate))
    plt.show()

    return parameters


# 预测函数
def predict(X, y, parameters):

    m = X.shape[1]
    n = len(parameters) // 2  # 神经网络的层数
    p = np.zeros((1, m))

    # 根据参数前向传播
    probas, caches = L_model_forward(X, parameters)

    for i in range(0, probas.shape[1]):
        if probas[0, i] > 0.5:
            p[0, i] = 1
        else:
            p[0, i] = 0

    print("准确度为: " + str(float(np.sum((p == y)) / m)))

    return p


# 绘制错误图像
def print_mislabeled_images(classes, X, y, p):
    """
	绘制预测和实际不同的图像。
	    X - 数据集
	    y - 实际的标签
	    p - 预测
    """
    a = p + y
    mislabeled_indices = np.asarray(np.where(a == 1))
    plt.rcParams['figure.figsize'] = (40.0, 40.0)  # set default size of plots
    num_images = len(mislabeled_indices[0])
    for i in range(num_images):
        index = mislabeled_indices[1][i]

        plt.subplot(2, num_images, i + 1)
        plt.imshow(X[:, index].reshape(64, 64, 3), interpolation='nearest')
        plt.axis('off')
        plt.title(
            "Prediction: " + classes[int(p[0, index])].decode("utf-8") + " \n Class: " + classes[y[0, index]].decode(
                "utf-8"))
        plt.show()


# 一些常数指定
# n_x = 12288 #输入特征为64*64*3
# n_h = 7
# n_y = 1
# 打印二层模型的成本
# parameters = two_layer_model(train_x, train_y, layers_dims = (n_x, n_h, n_y), num_iterations = 2500, print_cost=True)

# 打印L层模型的成本
layers_dims = [12288, 20, 7, 5, 1] #  5-layer model
parameters = L_layer_model(train_x, train_y, layers_dims, num_iterations=2500, print_cost=True)

# 预测
# prediction_train = predict(train_x, train_y, parameters)
prediction_test = predict(test_x, test_y, parameters)

# 绘制错误图像
print_mislabeled_images(classes, test_x, test_y, prediction_test)

# 读取自己的照片(如果复制代码的话,请更改下面jpg的名字)
num_px = 64
my_label_y = [1] # the true class of your image (1 -> cat, 0 -> non-cat)
#读取--转三通道RGB(如果本身是三通道可以移除)--变换像素64*64
image = np.array(Image.open('catvsnoncat.jpg').convert("RGB").resize((num_px, num_px)))
predit_image = image.reshape((num_px*num_px*3,1))
my_predicted_image = predict(predit_image, my_label_y, parameters)
plt.imshow(image)
plt.show()
print ("y = " + str(np.squeeze(my_predicted_image)) + ", your L-layer model predicts a \"" + classes[int(np.squeeze(my_predicted_image)),].decode("utf-8") +  "\" picture.")
