2. 刘二大人《PyTorch深度学习实践》作业--梯度下降
这里,我在刘老师的基础上做了改进,将线性函数改为了 y = w x + b y = wx+b y=wx+b,以下实现都是基于此线性函数做的。
1. 梯度下降
import numpy as np
import matplotlib.pyplot as plt
x_data = [1.0, 2.0, 3.0]
y_data = [3.0, 5.0, 7.0]

w = 1.0
b = 1.0

def forward(x):
    return x * w + b

# 损失函数
def cost(xs, ys):
    cost = 0
    for x, y in zip(xs, ys):
        y_pred = forward(x)
        cost += (y_pred - y) ** 2
    return cost / len(xs)

# 迭代,计算损失值
cost_list = []
print('Predict (before training)', 4, forward(4))
for epoch in range(100):
    cost_val = cost(x_data, y_data)
    grad_w, grad_b = gradient(x_data, y_data)
    w -= 0.01 * grad_w
    b -= 0.01 * grad_b
    cost_list.append(cost_val)
    print('Epoch:', epoch, 'w=', w,'b=', b, 'loss=', cost_val)
print('Predict (after training)', 4, forward(4))

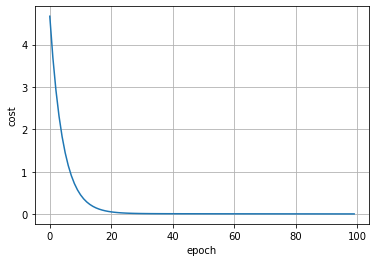
# 绘制图像
epoches = np.arange(0, 100, 1)
plt.xlabel('epoch')
plt.ylabel('cost')
plt.plot(epoches, cost_list)
plt.grid()
plt.show()
2. 随机梯度下降
x_data = [1.0, 2.0, 3.0]
y_data = [3.0, 5.0, 7.0]

w = 1.0
b = 1.0

def forward(x):
    return x * w + b

# 随机梯度下降算法
def sgd(x, y):
    y_pred = forward(x)
    grad_w = 0
    grad_b = 0
    grad_w += 2 * x * (y_pred - y)
    grad_b += 2 * (y_pred - y)
    return grad_w, grad_b

# 损失函数
def cost_sgd(x, y):
    y_pred = forward(x)
    return (y_pred - y) ** 2

# 迭代,计算损失值
cost_list = []
print('Predict (before training)', 4, forward(4))
for epoch in range(100):
    for x, y in zip(x_data, y_data):
        cost_val = cost_sgd(x, y)
        grad_w, grad_b = sgd(x, y)
        w -= 0.01 * grad_w
        b -= 0.01 * grad_b
        cost_list.append(cost_val)
        print('Epoch:', epoch, 'w=', w, 'b=', b, 'loss=', cost_val)
print('Predict (after training)', 4, forward(4))

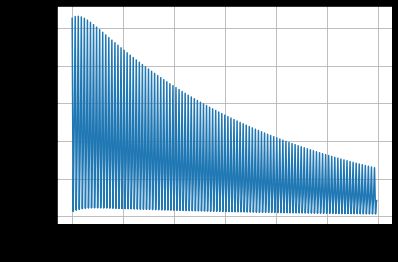
# 绘制图像
epoches = np.arange(0, 300, 1)
plt.xlabel('epoch')
plt.ylabel('cost')
plt.plot(epoches, cost_list)
plt.grid()
plt.show()

