【机器学习】吴恩达作业1.0,python实现线性回归预测
1.0单变量线性回归
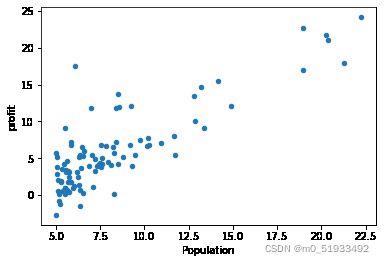
根据人口预测利润 输入变量只有一个特征 人口,输出变量为利润
损失函数
梯度下降函数
维度
X(m,n)y(m,1) theta(n,1)
导入数据并可视化
import numpy as np
import pandas as pd
import matplotlib.pyplot as plt
data = pd.read_csv('ex1data1.txt',names =[ 'Population','profit'])
data.head()
data.insert(0,'ones',1)
data.head()
data.plot.scatter('Population','profit')
plt.show()
数据切片处理
X = data.iloc[:,0:-1]
X.head()
X = X.values
X.shape
y = data.iloc[:,-1]
y.head()
y = y.values
y.shape
y = y.reshape(97,1)
y.shape
正规方程求theta
#正规方程
def normalEquation(X,y):
    theta = np.linalg.inv(X.T@X)@X.T@y
    return theta
theta = normalEquation(X,y)
print(theta)
theta.shape
代价函数
def cost_func(X,y,theta):
    inner = np.power(X@theta-y,2)
    return np.sum(inner)/(2*len(X))
theta = np.zeros((2,1))
theta.shape
cost1 = cost_func(X,y,theta)
print(cost1)梯度下降
def gradient_Abscent (X,y,theta,alpha,count):
    costs = []
    for i in range(count):
        theta = theta - (X.T @(X @ theta - y)) * alpha / len(X)
        cost = cost_func(X,y,theta)
        costs.append(cost)
        if i%100 == 0:
            print(cost)
    return theta,costs

alpha = 0.02
count = 2000
theta1,costs =gradient_Abscent(X,y,theta,alpha,count)
代价函数可视化
fig,ax = plt.subplots()
ax.plot(np.arange(count),costs)
ax.set(xlabel = 'count',ylabel = 'cost')
plt.show()
拟合函数可视化
#拟合函数可视化
x = np.linspace(y.min(),y.max(),100)#网格数据
y_ = theta1[0,0] + theta1[1,0]*x  # 取theta第一行第一个和第二行第一个

fig,ax = plt.subplots()
ax.scatter(X[:,1],y,label = 'training')#绘制数据集散点图取x所有行,第2列population
ax.plot(x,y_,'r',label = 'predict')#绘制预测后的直线
ax.legend()
ax.set(xlabel = 'population',ylabel = 'profit')
plt.show()
预测
x_predict = float(input('输入预测人口:'))
predict1 = np.array([1,x_predict])@theta1
print(predict1)
2.0多变量线性回归
预测房价,输入变量有两个特征,房子面积,房子卧室数量。输出变量,房子的价格
读取数据
import numpy as np
import pandas as pd
import matplotlib.pyplot as plt
#读取数据
data =  pd.read_csv('ex1data2.txt',names = ['size','bedrooms','price'])#文件路径,我的数据集在同文件夹
data.head()#查看前五行
均值归一化
#均值归一化
def normalize_feature(data):#定义均值归一化函数
    return (data - data.mean())/data.std()#(x-x的均值)/x的方差
data = normalize_feature(data)#调用均值归一化函数
data.head()#查看均值归一后数据集前五行
数据可视化
#数据集可视化
data.plot.scatter('size','price',label = 'size')#画出房间大小与价格数据集散点图
plt.show()
data.plot.scatter('bedrooms','price',label = 'size')#画出卧室数量大小与价格数据集散点图
plt.show()

data.insert(0,'ones',1)#在数据集中插入第一列,列名为ones,数值为1
data.head()
处理数据
#数据切片
x = data.iloc[:,0:-1]#取x的所有行,取x第一列之后的所有列
x.head()
x = x.values #将x由dataframe(数据框)格式转化为ndarray(多维数组)格式
x.shape #查看x的形状  (47, 3)

y = data.iloc[:,-1]
y.head()
y = y.values
y.shape     #(47,)

y = y.reshape(47,1)#对y的格式进行转化
y.shape     #(47,1)
代价函数
#损失函数
def cost_func(x,y,theta):
    inner = np.power(x@theta-y,2)
    return np.sum(inner)/(2*len(x)) #调用np.power,幂数为2

#初始化参数theta
theta = np.zeros((3,1))#将theta初始化为一个(3,1)的数组
#yinwei
cost1 = cost_func(x,y,theta)#初始化theta得到的代价函数值
梯度下降
#梯度下降
def gradientDescent(x,y,theta,counts):
    costs = []#创建存放总损失值的空列表
    for i in range(counts):#遍历迭代次数
        theta = theta - x.T@(x@theta-y)*alpha/len(x)
        cost = cost_func(x,y,theta)#调用损失函数得到迭代一次的cost
        costs.append(cost)#将cost传入costs列表
        if i%100 == 0:  #迭代100次,打印cost值
            print(cost)
    return theta,costs
不同学习率下损失函数的迭代
alpha_iters = [0.003,0.03,0.0001,0.001,0.01]#设置alpha
counts = 200#循环次数
fig,ax = plt.subplots()
for alpha in alpha_iters:#迭代不同学习率alpha
_,costs = gradientDescent(x,y,theta,counts)#得到损失值
ax.plot(np.arange(counts),costs,label = alpha)#设置x轴参数为迭代次数,y轴参数为cost
ax.legend() #加上这句 显示label
ax.set(xlabel= 'counts', #图的坐标轴设置
ylabel = 'cost',
title = 'cost vs counts')#标题
plt.show()#显示图像
总结
导入模块——读取数据 ——均值归一化——数据可视化——处理数据集——代价函数——梯度下降_预测


