openpyxl操作ecxel制作报告模板
openpyxl操作ecxel制作报告模板
此篇博客是让大家感受到openpyxl的功能之强大,给大家有更多的想象和发挥的空间。
文章目录
- openpyxl操作ecxel制作报告模板
-
-
- 效果图
- 代码展示
- 遗憾
-
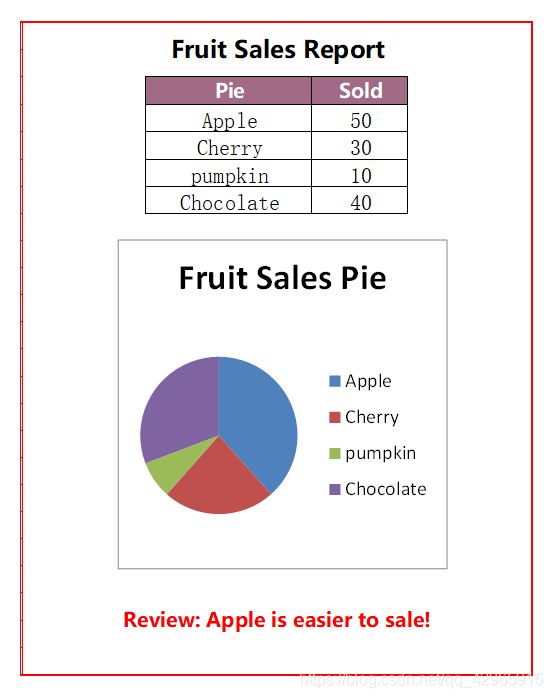
效果图
代码展示
以下为完整代码,就不拆分了,如果不熟悉openpyxl可以去B站,观看 PythonABC 的P24-P28小节进行学习。如果觉得我这篇博客对你有所启发,不要忘记点赞哦!
#!/usr/bin/env python
# -*- coding: utf-8 -*-
# @File  : practice1.py
# @Author: yph
# @Date  : 2021/3/21

import openpyxl as ox
from openpyxl.styles import Font, colors, PatternFill, Alignment, Border, Side
from openpyxl.chart import PieChart, Reference

DATA = [
    ["Pie", "Sold"],
    ["Apple", 50],
    ["Cherry", 30],
    ["pumpkin", 10],
    ["Chocolate", 40],
]


# 设置初始表格样式
def init_style(worksheet: ox.worksheet.worksheet.Worksheet):
    ws.column_dimensions["A"].width = 0.2
    ws.column_dimensions["H"].width = 0.2
    ws.row_dimensions[1].height = 0.5
    ws.row_dimensions[26].height = 0.5
    sideStyle = Side(border_style="thin", color="ffffff")
    border = Border(left=sideStyle, right=sideStyle, top=sideStyle, bottom=sideStyle)
    BsideStyle = Side(border_style="thin", color="FF0000")
    Bborder = Border(left=BsideStyle, right=BsideStyle, top=BsideStyle, bottom=BsideStyle)
    # 使得规定范围内的单元格取消边线,即将边线设为白色
    for row in range(1, 50):
        for col in range(1, 26):
            ws.cell(row=row, column=col).border = border
    # 整个页面边框宽度及样式设置
    for colCells in worksheet["A1:A26"] + worksheet["H1:H26"]:
        for colCell in colCells:
            colCell.fill = PatternFill(patternType="solid", fgColor=colors.Color("FF0000"))
            colCell.border = Bborder
    for rowCells in worksheet["A1:H1"] + worksheet["A26:H26"]:
        for rowCell in rowCells:
            rowCell.fill = PatternFill(patternType="solid", fgColor="FF0000")
            rowCell.border = Bborder

    #  标题设置
    worksheet.merge_cells("C2:F3")
    worksheet["C2"] = "Fruit Sales Report"
    worksheet["C2"].alignment = Alignment(horizontal="center", vertical="center")
    worksheet["C2"].font = Font(name=u"微软雅黑", size=12, bold=True)
    return worksheet


def set_style(cells: tuple, font=None, fill=None, alignment=None, border=None, numFormat=None, fontColor="000000", bgColor=None):
    """
    设置单元格样式
    :param cells:
    :param font:
    :param fill:
    :param alignment:
    :param border:
    :param numFormat:
    :param fontColor:
    :param bgColor:
    :return:
    """
    # 设置字体样式
    myFont = Font(name=u"微软雅黑", size=10, bold=True, color=fontColor)
    # 设置文字布局
    myAlignment = Alignment(horizontal="center", vertical="center")
    # 设置边框样式
    sideStyle = Side(border_style="thin", color="000000")
    myBorder = Border(left=sideStyle, right=sideStyle, top=sideStyle, bottom=sideStyle)
    # 对目标单元格进行样式设置
    for rowCells in cells:
        for cell in rowCells:
            if font is not None:
                cell.font = myFont
            if numFormat is not None:
                cell.number_format = "0.00%"
            if alignment is not None:
                cell.alignment = myAlignment
            if border is not None:
                cell.border = myBorder
            if fill is not None:
                cell.fill = PatternFill("solid", fgColor=bgColor)  # solid为样式

wb = ox.Workbook()
# 默认激活第一个worksheet
ws = wb.active
# worksheet命名
ws.title = "Temple"
# 设置D列宽度
ws.column_dimensions["D"].width = 15
# 将数据写入worksheet
for row in range(4, len(DATA)+4):
    for col in range(4, 6):
        ws.cell(column=col, row=row, value=DATA[row-4][col-4])

# 初始化表格样式
ws = init_style(ws)
headCells = ws["D4:E4"]
set_style(headCells, border=True, font=True, alignment=True, fill=True, fontColor="ffffff", bgColor="a16a85")
bodyCells = ws["D5:E8"]
set_style(bodyCells, border=True, alignment=True)

# 绘制饼图
pie = PieChart()
data = Reference(ws, min_col=5, max_row=8, min_row=5)
labels = Reference(ws, min_row=5, min_col=4, max_row=8)
pie.add_data(data)
pie.set_categories(labels)
pie.title = "Fruit Sales Pie"
pie.width = 5.8
pie.height = 5.8
ws.add_chart(pie, "C10")

# 排版设置
ws.column_dimensions["C"].width = 2.5
ws.column_dimensions["F"].width = 2.5
ws.merge_cells("C23:F24")
# 评论语书写区
ws.cell(row=23, column=3, value="Review: Apple is easier to sale!").font = Font(name=u"微软雅黑", color="FF0000", bold=True)
ws["C23"].alignment = Alignment(horizontal="left", vertical="center",shrink_to_fit=True)
wb.save("practice1.xlsx")
遗憾
未能实现图标的无边框,看着总是不舒服,如果那位伙伴解决了,希望能在下面留言哦!
