ELK+kafka+zookeeper部署文档
一、介绍
ElasticSearch是一个基于Lucene的搜索服务器
Kibana是一个使用 Apache 开源协议,基于浏览器的 Elasticsearch 分析和搜索仪表板
Logstash 是一款强大的数据处理工具,它可以实现数据传输,格式处理,格式化输出,还有强大的插件功能,常用于日志处理
Filebeat是本地文件的日志数据采集器
Auditbeat轻量型审计日志采集器,收集Linux 审计框架的数据,监控文件完整性
Heartbeat轻量型运行时间监控采集器,通过主动探测来监控服务可用性。
Packetbeat是一款轻量型网络数据包分析器,用于深挖网线上传输的数据,了解应用程序动态
Metricbeat用于从系统和服务收集指标
以上计划安装的 ES、Kibana、Logstash、Filebeat,其他测试环境部署
二、ELK服务架构
redis架构
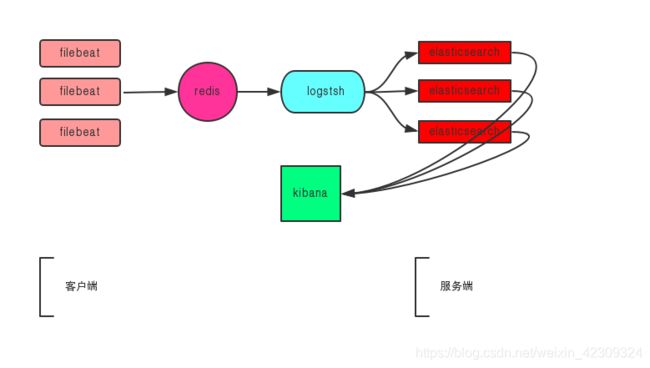
架构解读 : (整个架构从左到右,总共分为5层)
第一层、数据采集层
最左边的是filebeat采集,负责将数据传输至redis服务。
第二层、数据缓存层
redis将数据放置在内存当中,由logstash从redis中获取数据。
第三层、数据转发层
Logstash节点实时去redis获取数据,转发至ES DataNode。
第四层、数据持久化存储
ES DataNode 会把收到的数据,写磁盘,建索引库。
第五层、数据检索,数据展示
ES Master + Kibana 主要 协调 ES集群,处理数据检索请求,数据展示。
kafka架构

第一层、数据采集层
最左边的安装了filebeat做日志采集,数据传输给kafka broker+zookeeper 集群。
第二层、数据缓存层
filebeat服务把日志转存到本地的kafka broker+zookeeper 集群中。
第三层、数据转发层
远程Logstash节点实时去kafka broker集群拉数据,转发至ES DataNode。
第四层、数据持久化存储
ES DataNode 把收到的数据,写磁盘,建索引库。
第五层、数据检索,数据展示
ES Master + Kibana 主要 协调 ES集群,处理数据检索请求,数据展示。
三、安装ELK服务
安装elasticsearch
导入Elasticsearch PGP密钥
rpm --import https://artifacts.elastic.co/GPG-KEY-elasticsearch
添加Elasticsearch.repo
cat /etc/yum.repos.d/elasticsearch.rep
[elasticsearch-6.x]
name=Elasticsearch repository for 6.x packages
baseurl=https://artifacts.elastic.co/packages/6.x/yum
gpgcheck=1
gpgkey=https://artifacts.elastic.co/GPG-KEY-elasticsearch
enabled=1
autorefresh=1
type=rpm-md
yum 安装Elasticsearch
yum install elasticsearch -y
或者手动下载RPM包
wget https://artifacts.elastic.co/downloads/elasticsearch/ elasticsearch -6.6.2.rpm
wget https://artifacts.elastic.co/downloads/elasticsearch/elasticsearch-6.6.2.rpm.sha512
shasum -a 512 -c elasticsearch-6.6.2.rpm.sha512
sudo rpm --install elasticsearch-6.6.2.rpm
通过init 启动elasticsearch服务
chkconfig --add elasticsearch
service elasticsearch start
service elasticsearch stop
通过systemd 启动elasticsearch服务
/bin/systemctl daemon-reload
/bin/systemctl enable elasticsearch.service
systemctl start elasticsearch.service
systemctl stop elasticsearch.service
检查elasticsearch 是否运行
访问localhost:9200 端口,获取返回值:
{
“name” : “Cp8oag6”,
“cluster_name” : “elasticsearch”,
“cluster_uuid” : “AT69_T_DTp-1qgIJlatQqA”,
“version” : {
"number" : "6.6.2",

"build_flavor" : "default",

"build_type" : "zip",

"build_hash" : "f27399d",

"build_date" : "2016-03-30T09:51:41.449Z",

"build_snapshot" : false,

"lucene_version" : "7.6.0",

"minimum_wire_compatibility_version" : "1.2.3",

"minimum_index_compatibility_version" : "1.2.3"
},
“tagline” : “You Know, for Search”
}
配置文件:
[root@localhost ~]# ll /etc/elasticsearch/elasticsearch.yml
-rw-rw----. 1 root elasticsearch 3359 4月 24 09:37 /etc/elasticsearch/elasticsearch.yml
[root@localhost ~]# ll /etc/sysconfig/elasticsearch
-rw-rw----. 1 root elasticsearch 1613 4月 6 07:06 /etc/sysconfig/elasticsearch
使用RPM 安装完成后程序路径:
home /usr/share/elasticsearch
bin /usr/share/elasticsearch/bin
conf /etc/elasticsearch
conf /etc/sysconfig/elasticsearch 环境变量,包括堆大小,文件描述符
data /var/lib/elasticsearch 数据节点
logs /var/log/elasticsearch 日志文件目录
plugins /usr/share/elasticsearch/plugins 插件目录
安装logstash
yum 安装logstash
yum install logstash
启动logstash
Init启动
/etc/init.d/logstash start
System启动
systemctl start logstash.service
安装kibana
yum 安装kibana
Init启动
/etc/init.d/logstash start
service kibana start
service kibana stop
chkconfig --add kibana
System启动
systemctl start kibana.service
安装kafka、zookeeper
[root@qnelk1 ~]# su - zookeeper
[zookeeper@qnelk1 ~]$ tar -xf kafka-2.2.0-src.tgz
[zookeeper@qnelk1 ~]$ tar -xvf zookeeper-3.4.14.tar.gz
[zookeeper@qnelk1 ~]$ mv zookeeper-3.4.14 zookeeper
[zookeeper@qnelk1 ~]$ mv kafka-2.2.0-src kafka
[zookeeper@qnelk1 ~]$ mv /home/zookeeper/{data,logs}
[zookeeper@qnelk1 ~]$ cp /home/zookeeper/zookeeper/conf/zoo_sample.cfg /home/zookeeper/zookeeper/conf/zoo.cfg
安装filebeat
[root@bdsmng104 ~]#
curl -L -O https://artifacts.elastic.co/downloads/beats/filebeat/filebeat-6.6.2-x86_64.rpm
[root@bdsmng104 ~]# rpm -ivh filebeat-6.6.2-x86_64.rpm
四、修改配置文件
elasticsearch配置项
[root@qnelk1 ~]# cat /etc/elasticsearch/elasticsearch.yml
cluster.name: my-qn
node.name: node-1
node.master: true
node.data: false
node.ingest: true
path.data: /var/lib/elasticsearch
path.logs: /var/log/elasticsearch
network.host: 0.0.0.0
http.port: 9200
transport.tcp.port: 9300
transport.host: 10.130.44.238
network.bind_host: 10.130.44.238
network.publish_host: 10.130.44.238
bootstrap.memory_lock: false
http.cors.enabled: true
http.cors.allow-origin: “*”
http.cors.allow-credentials: true
discovery.seed_hosts: [“10.130.44.238:9300”,“10.130.44.237:9300”,“10.130.44.236:9300”]
cluster.initial_master_nodes: [“node-1”, “node-2”]
gateway.recover_after_nodes: 3
logstash配置项
cat /etc/logstash/conf.d/logstash-kafka.conf
input {
kafka {
enable_auto_commit => true
auto_commit_interval_ms => “1000”
consumer_threads => “5”
decorate_events => true
codec => “json”
bootstrap_servers => “qnelk1.ccod.com:9092,qnelk2.ccod.com:qnelk3.ccod.com:9094”
topics => [“spring”]
output {
elasticsearch {
hosts => [“10.130.44.238:9200”]
index => “spring-%{+YYYY.MM.dd}”
kibana配置项
[root@localhost ~]# cat /etc/kibana/kibana.yml
server.host: “10.130.44.238”
elasticsearch.hosts: [“http://10.130.44.238:9200”]
kafka配置项
[zookeeper@qnelk1 config]$ cat /home/zookeeper/kafka/config/server.properties
broker.id=1
auto.create.topics.enable=true
port=9093
host.name=qnelk2.ccod.com
num.network.threads=30
num.io.threads=30
socket.send.buffer.bytes=102400
socket.receive.buffer.bytes=102400
socket.request.max.bytes=104857600
log.dirs=/home/zookeeper/kafka/logs/
num.partitions=10
num.recovery.threads.per.data.dir=1
default.replication.factor=2
log.retention.hours=168
log.segment.bytes=1073741824
log.retention.check.interval.ms=300000
zookeeper.connect=172.16.221.150:2181,172.16.221.151:2181,172.16.221.152:2181
zookeeper.connection.timeout.ms=6000
zookeeper配置项
[zookeeper@qnelk1 ~]$ cat /home/zookeeper/zookeeper/conf/zoo.cfg
tickTime=2000
initLimit=10
syncLimit=5
dataDir=/home/zookeeper/data/
clientPort=2181
dataLogDir=/home/zookeeper/logs/
initLimit=5
syncLimit=2
server.1=172.16.221.150:2888:3888
server.2=172.16.221.151:2888:3888
server.3=172.16.221.152:2888:3888
touch /home/zookeeper/data/myid;echo “3” > myid
filebeat配置项
[root@bdsmng104 ~]# cat /etc/filebeat/filebeat.yml
filebeat.inputs:
- type: log
enabled: true
paths: - /home/data/logs/.log
multiline.pattern: ^[
multiline.negate: true
multiline.match: after
filebeat.config.modules:
path: ${path.config}/modules.d/.yml
reload.enabled: false
setup.template.settings:
index.number_of_shards: 3
setup.kibana:
output.kafka:
enabled: true
hosts: [“qnelk1.ccod.com:9092”, “qnelk2.ccod.com:9093”, “qnelk3.ccod.com:9094”]
topic: “spring”
partition.round_robin:
reachable_only: false
required_acks: 1
compression: gzip
max_message_bytes: 1000000
processors: - add_host_metadata: ~
- add_cloud_metadata: ~
五、启动ELK服务
启动elasticsearch
service elasticsearch start
启动logstash
service logstash start
启动kibana
service kibana start
启动kafka
sh /home/zookeeper/kafka/bin/kafka-server-start.sh /home/zookeeper/kafka/config/server.properties
启动zookeeper
sh /home/zookeeper/zookeeper/bin/zkServer.sh start
启动filebeat
service filebeat start
六、结束
通过门户访问kibana.
本文档旨在ELK服务部署,logstash数据清洗、Elasticsearch的使用另行学习。
参加文档:https://www.elastic.co/guide/index.html