Tensorflow2+训练CIFAR10
一、下载数据集并展示
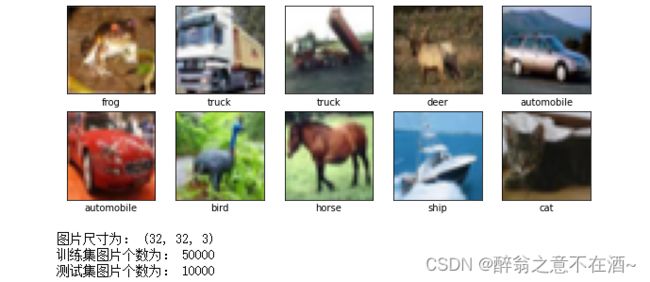
CIFAR-10 是由 Hinton 的学生 Alex Krizhevsky 和 Ilya Sutskever 整理的一个用于识别普适物体的小型数据集。一共包含 10 个类别的 RGB 彩色图 片:飞机( a叩lane )、汽车( automobile )、鸟类( bird )、猫( cat )、鹿( deer )、狗( dog )、蛙类( frog )、马( horse )、船( ship )和卡车( truck )。图片的尺寸为 32×32 ,数据集中一共有 50000 张训练圄片和 10000 张测试图片。 CIFAR-10 的图片样例如图所示。
与 MNIST 数据集中目比, CIFAR-10 具有以下不同点:
• CIFAR-10 是 3 通道的彩色 RGB 图像,而 MNIST 是灰度图像。
• CIFAR-10 的图片尺寸为 32×32, 而 MNIST 的图片尺寸为 28×28,比 MNIST 稍大。
• 相比于手写字符, CIFAR-10 含有的是现实世界中真实的物体,不仅噪声很大,而且物体的比例、 特征都不尽相同,这为识别带来很大困难。
import matplotlib.pyplot as plt
import tensorflow as tf
from keras import datasets, layers, models
from tensorflow.keras.preprocessing.image import ImageDataGenerator
%config Completer.use_jedi = False

(train_images, train_labels), (test_images, test_labels) = tf.keras.datasets.cifar10.load_data()

class_names = ['airplane', 'automobile', 'bird', 'cat', 'deer',
               'dog', 'frog', 'horse', 'ship', 'truck']

plt.figure(figsize=(10, 10))
for i in range(10):
    plt.subplot(5, 5, i + 1)
    plt.xticks([])
    plt.yticks([])
    plt.grid(False)
    plt.imshow(train_images[i], cmap=plt.cm.binary)
    plt.xlabel(class_names[train_labels[i][0]])
plt.show()

#查看图片信息
print('图片尺寸为:',train_images[0].shape)
print('训练集图片个数为:',len(train_images))
print('测试集图片个数为:',len(test_images))
如果使用代码下载失败,那么去到cifar10数据集下载地址:https://www.cs.toronto.edu/~kriz/cifar-10-python.tar.gz,将下载后的文件存放在 ~./keras/datasets目录下,~表示当前用户路径。
二、构建模型
# 构造网络模型
model = models.Sequential([
    tf.keras.layers.Conv2D(32, (3,3), activation='relu', input_shape=(32, 32, 3)),
    tf.keras.layers.MaxPooling2D(2,2),

    tf.keras.layers.Conv2D(64, (3,3), activation='relu'),
    tf.keras.layers.MaxPooling2D(2,2),

    tf.keras.layers.Conv2D(128, (3,3), activation='relu'),
    tf.keras.layers.MaxPooling2D(2,2),

    #转换为一维
    tf.keras.layers.Flatten(),
    tf.keras.layers.Dense(128, activation='relu'),
    tf.keras.layers.Dropout(0.5),
    tf.keras.layers.Dense(10, activation='softmax'),
])

# 查看网络结构
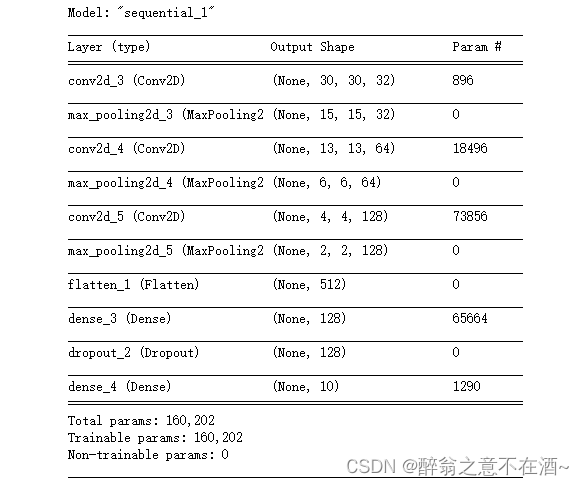
model.summary()
三、定义损失函数优化器
model.compile(optimizer='adam',
              loss='sparse_categorical_crossentropy',
              metrics=['accuracy'])
四、数据增强
注意此处只对训练数据集做随机翻转、随机裁剪、平移等,测试集只需归一化。
train_image = ImageDataGenerator(
    rescale=1/255,
    #随机翻转
    rotation_range=40,
    #平移
    width_shift_range=0.2,
    height_shift_range=0.2,
    #随机裁剪
    shear_range=0.2,
    #随机缩放
    zoom_range=0.2,
    horizontal_flip=True,
    fill_mode='nearest'
)

test_image = ImageDataGenerator(
    rescale=1/255,
)
五、模型训练
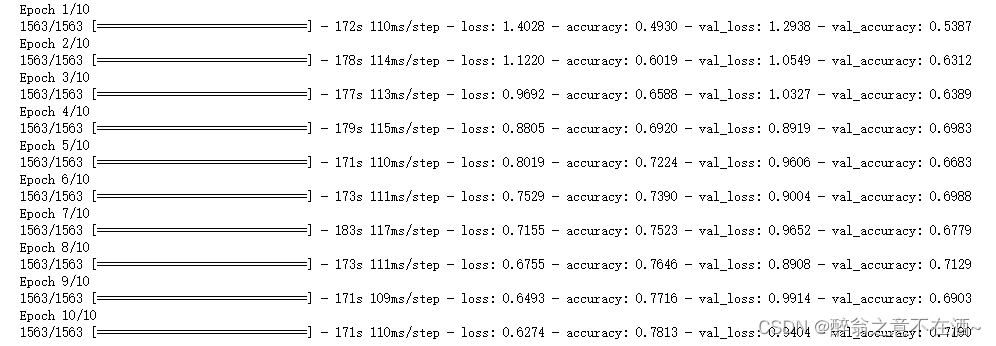
history = model.fit(train_images, train_labels, epochs=20,
                    validation_data=(test_images, test_labels))
六、绘制acc
# 测试模型并绘制loss图(history的使用)
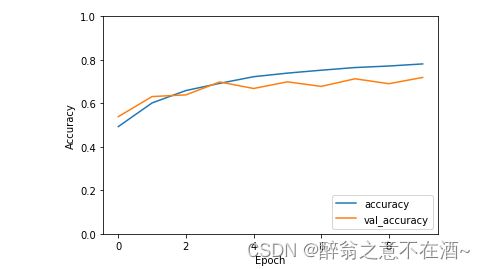
plt.plot(history.history['accuracy'], label='accuracy')
plt.plot(history.history['val_accuracy'], label='val_accuracy')
plt.xlabel('Epoch')
plt.ylabel('Accuracy')
plt.ylim([0.0, 1.0])
plt.legend(loc='lower right')
plt.show()
注:此处只做流程演示并未调整参数,可以自行优化。


