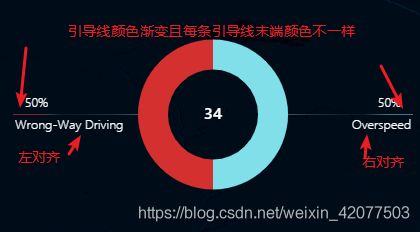
echarts饼状图引导线左右对称渐变、引导线上文字左右对齐(Vue实现)
效果图:

大致思路:
平时看echart是官网的例子大多数都是在option里面直接添加属性,但是如果想要达到每一条数据的样式都不一样采用这种方式是无法实现的。
其实可以通过series.data等于一个属性的对象来实现。
提示:该demo数据最多8条
option:
var option = {
        tooltip: {},
        series: [
          {
            type: 'pie',
            radius: [45, 75],
            roseType: 'area',
            height: '205px',
            clockwise: false,
            data: this.dataObj,  // 重点看这里
            label: { // 文字
              color: '#ffffff',
              fontWeight: 12,
              fontFamily: 'SegoeUI',
              // align: 'right',
              alignTo: 'labelLine',
              // formatter: '{d}%\n{b}',
              padding: [0, -30],
              formatter: [
                '{a|{d}%}',
                '{b|{b}}'
              ].join('\n'),
              rich: {
                a: {
                  color: '#ffffff',
                  fontWeight: 14,
                  fontFamily: 'SegoeUI-Semibold',
                  width: 1,
                  align: 'center',
                  padding: [0, 0, 5, 0]
                },
                b: {
                  color: '#ffffff',
                  fontWeight: 12,
                  fontFamily: 'SegoeUI',
                  align: 'center',
                  width: 1,
                  padding: [5, 0, 0, 0]
                }
              }
            },
            labelLine: { // 引导线
              length2: this.length,
              lineStyle: {
                // color: '#ffffff',
                width: 1,
                color: {
                  type: 'linear',
                  x: 0,
                  y: 0,
                  x2: 1,
                  y2: 1,
                  colorStops: [{
                    offset: 0, color: '#FFFFFF' // 0% 处的颜色
                  }, {
                    offset: 0.5, color: 'rgba(255,255,255,0.2)' // 100% 处的颜色
                  }, {
                    offset: 1, color: '#FFFFFF' // 100% 处的颜色
                  }],
                  global: false // 缺省为 false
                },
                opacity: 0.5
              }
            },
            itemStyle: { // 饼状部分
              color: (seriesIndex) => {
                return this.color[seriesIndex.dataIndex]
              }
            }
          }
        ]
      }
这部分主要功能是设置了一些公共的属性以及默认的引导线样式
dataObj:
this.dataObj = []
      var num = this.data.length
      var line = Math.ceil(num / 2)
      this.length = this.lengthArr[num - 1]
for (var i = 0; i < this.data.length; i++) {
        var temp = {}
        if (i < line) {
          temp = {
            value: this.data[i],
            name: this.name[i],
            labelLine: {
              lineStyle: {
                color: {
                  type: 'linear',
                  x: 0,
                  y: 0,
                  x2: 1,
                  y2: 1,
                  colorStops: [{
                    offset: 1, color: 'rgba(255,255,255,0.6)' // 0% 处的颜色
                  }, {
                    offset: 0.8, color: 'rgba(255,255,255,0.3)' // 100% 处的颜色
                  }, {
                    offset: 0.4, color: 'rgba(255,255,255,0.1)' // 100% 处的颜色
                  }, {
                    offset: 0.2, color: this.endColor[i] // 100% 处的颜色
                  }, {
                    offset: 0, color: this.endColor[i] // 100% 处的颜色
                  }],
                  global: false // 缺省为 false
                }
              }
            },
            label: {
              rich: {
                a: {
                  color: '#ffffff',
                  fontWeight: 14,
                  fontFamily: 'SegoeUI-Semibold',
                  width: 1,
                  align: 'center',
                  padding: [0, 0, 5, 0]
                },
                b: {
                  color: '#ffffff',
                  fontWeight: 12,
                  fontFamily: 'SegoeUI',
                  align: 'left',
                  width: 1,
                  padding: [5, 0, 0, -20]
                }
              }
            }
          }
        } else {
          temp = {
            value: this.data[i],
            name: this.name[i],
            labelLine: {
              lineStyle: {
                color: {
                  type: 'linear',
                  x: 0,
                  y: 0,
                  x2: 1,
                  y2: 1,
                  colorStops: [{
                    offset: 1, color: this.endColor[i] // 0% 处的颜色
                  }, {
                    offset: 0.8, color: this.endColor[i] // 100% 处的颜色
                  }, {
                    offset: 0.6, color: 'rgba(255,255,255,0.1)' // 100% 处的颜色
                  }, {
                    offset: 0.2, color: 'rgba(255,255,255,0.3)' // 100% 处的颜色
                  }, {
                    offset: 0, color: 'rgba(255,255,255,0.6)' // 100% 处的颜色
                  }],
                  global: false // 缺省为 false
                }
              }
            },
            label: {
              rich: {
                a: {
                  color: '#ffffff',
                  fontWeight: 14,
                  fontFamily: 'SegoeUI-Semibold',
                  width: 1,
                  align: 'center',
                  padding: [0, 0, 5, 0]
                },
                b: {
                  color: '#ffffff',
                  fontWeight: 12,
                  fontFamily: 'SegoeUI',
                  align: 'right',
                  width: 1,
                  padding: [5, -20, 0, 0]
                }
              }
            }
          }
        }
        this.dataObj.push(temp)
      }
这部分主要是通过总数来判断数据的引导线会出现在左侧还是右侧,然后赋予不同的样式。
完整代码:
<template>
  <div id="illegalActivitiesEcharts" style="width: 110%;height:280px;" class="echarts"></div>
</template>

<script>
export default {
  arr: 'illegalActivitiesStatisticsForm',
  data () {
    return {
      color: ['#D4302F', '#81DFEA', '#4DD0E2', '#29B6F7', '#06A9F4', '#029CE5', '#0388D2', '#01579B'], // 第一个是红色,代表数量最多的违法行为
      endColor: ['#F44336', '#81DFEA', '#4DD0E2', '#29B6F7', '#06A9F4', '#029CE5', '#0388D2', '#01579B'], // 末端的颜色
      length: 118, // 不同数量下的引导线长度
      lengthArr: [100, 110, 123, 135, 115, 110, 110, 118],
      dataObj: [] // series数据
    }
  },
  props: {
    data: Array,
    name: Array
  },
  watch: {
    data () {
      this.getData()
      this.drawLine()
    }
  },
  methods: {
    drawLine () {
      var echarts = require('echarts')
      // 基于准备好的dom,初始化echarts实例
      var myChart = echarts.init(document.getElementById('illegalActivitiesEcharts'))

      // 指定图表的配置项和数据
      var option = {
        tooltip: {},
        series: [
          {
            type: 'pie',
            radius: [45, 75],
            roseType: 'area',
            height: '205px',
            clockwise: false,
            data: this.dataObj,
            label: { // 文字
              color: '#ffffff',
              fontWeight: 12,
              fontFamily: 'SegoeUI',
              // align: 'right',
              alignTo: 'labelLine',
              // formatter: '{d}%\n{b}',
              padding: [0, -30],
              formatter: [
                '{a|{d}%}',
                '{b|{b}}'
              ].join('\n'),
              rich: {
                a: {
                  color: '#ffffff',
                  fontWeight: 14,
                  fontFamily: 'SegoeUI-Semibold',
                  width: 1,
                  align: 'center',
                  padding: [0, 0, 5, 0]
                },
                b: {
                  color: '#ffffff',
                  fontWeight: 12,
                  fontFamily: 'SegoeUI',
                  align: 'center',
                  width: 1,
                  padding: [5, 0, 0, 0]
                }
              }
            },
            labelLine: { // 引导线
              length2: this.length,
              lineStyle: {
                // color: '#ffffff',
                width: 1,
                color: {
                  type: 'linear',
                  x: 0,
                  y: 0,
                  x2: 1,
                  y2: 1,
                  colorStops: [{
                    offset: 0, color: '#FFFFFF' // 0% 处的颜色
                  }, {
                    offset: 0.5, color: 'rgba(255,255,255,0.2)' // 100% 处的颜色
                  }, {
                    offset: 1, color: '#FFFFFF' // 100% 处的颜色
                  }],
                  global: false // 缺省为 false
                },
                opacity: 0.5
              }
            },
            itemStyle: { // 饼状部分
              color: (seriesIndex) => {
                return this.color[seriesIndex.dataIndex]
              }
            }
          }
        ]
      }

      // 使用刚指定的配置项和数据显示图表。
      myChart.setOption(option)
    },
    getData () {
      this.dataObj = []
      var num = this.data.length
      var line = Math.ceil(num / 2)
      this.length = this.lengthArr[num - 1]
      for (var i = 0; i < this.data.length; i++) {
        var temp = {}
        if (i < line) {
          temp = {
            value: this.data[i],
            name: this.name[i],
            labelLine: {
              lineStyle: {
                color: {
                  type: 'linear',
                  x: 0,
                  y: 0,
                  x2: 1,
                  y2: 1,
                  colorStops: [{
                    offset: 1, color: 'rgba(255,255,255,0.6)' // 0% 处的颜色
                  }, {
                    offset: 0.8, color: 'rgba(255,255,255,0.3)' // 100% 处的颜色
                  }, {
                    offset: 0.4, color: 'rgba(255,255,255,0.1)' // 100% 处的颜色
                  }, {
                    offset: 0.2, color: this.endColor[i] // 100% 处的颜色
                  }, {
                    offset: 0, color: this.endColor[i] // 100% 处的颜色
                  }],
                  global: false // 缺省为 false
                }
              }
            },
            label: {
              rich: {
                a: {
                  color: '#ffffff',
                  fontWeight: 14,
                  fontFamily: 'SegoeUI-Semibold',
                  width: 1,
                  align: 'center',
                  padding: [0, 0, 5, 0]
                },
                b: {
                  color: '#ffffff',
                  fontWeight: 12,
                  fontFamily: 'SegoeUI',
                  align: 'left',
                  width: 1,
                  padding: [5, 0, 0, -20]
                }
              }
            }
          }
        } else {
          temp = {
            value: this.data[i],
            name: this.name[i],
            labelLine: {
              lineStyle: {
                color: {
                  type: 'linear',
                  x: 0,
                  y: 0,
                  x2: 1,
                  y2: 1,
                  colorStops: [{
                    offset: 1, color: this.endColor[i] // 0% 处的颜色
                  }, {
                    offset: 0.8, color: this.endColor[i] // 100% 处的颜色
                  }, {
                    offset: 0.6, color: 'rgba(255,255,255,0.1)' // 100% 处的颜色
                  }, {
                    offset: 0.2, color: 'rgba(255,255,255,0.3)' // 100% 处的颜色
                  }, {
                    offset: 0, color: 'rgba(255,255,255,0.6)' // 100% 处的颜色
                  }],
                  global: false // 缺省为 false
                }
              }
            },
            label: {
              rich: {
                a: {
                  color: '#ffffff',
                  fontWeight: 14,
                  fontFamily: 'SegoeUI-Semibold',
                  width: 1,
                  align: 'center',
                  padding: [0, 0, 5, 0]
                },
                b: {
                  color: '#ffffff',
                  fontWeight: 12,
                  fontFamily: 'SegoeUI',
                  align: 'right',
                  width: 1,
                  padding: [5, -20, 0, 0]
                }
              }
            }
          }
        }
        this.dataObj.push(temp)
      }
    }
  },
  mounted () {
    this.getData()
    this.drawLine()
  }
}
</script>

<style scoped>
.echarts {
  position: relative;
  top: 24px;
  right: 20px;
}
</style>