echarts相关问题

1、legend 每个label长度不一样 需要对齐时,自定义每一项的样式
echarts相关问题_第1张图片

   this.legendData = [
            {
              data: [dataList[0].name],
              left: '20px',
              formatter: function (name) {
                return '{a|' +  name + '}'
              },
              textStyle: {
                color: '#78A0C2',
                backgroundColor: "transparent", 
                rich: {
                  a: {
                    width:260
                  }
                }
              },
              icon: 'rect', // 形状
              itemWidth: 6, // 宽
              itemHeight: 6 // 高
            },
            {
              data: [dataList[2].name],
              textStyle: {
                color: '#78A0C2',
                backgroundColor: "transparent", 
                width:240
              },
               left: '310px',
              icon: 'rect',
              itemWidth: 6,
              itemHeight: 6
            },
            {
              data: [dataList[1].name],
              left: '20px',
              top: '20px',
              textStyle: {
                color: '#78A0C2'
              },
              icon: 'rect',
              itemWidth: 6,
              itemHeight: 6
            },
            {
              data: [dataList[3].name],
              left: '310px',
              top: '20px',
              textStyle: {
                color: '#78A0C2'
              },
              icon: 'rect',
              itemWidth: 6,
              itemHeight: 6
            }
          ]

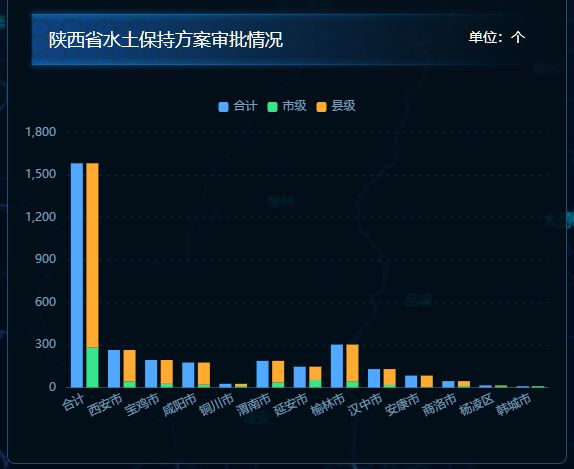
2、 x轴lable放置不下旋转、强制显示不间隔

echarts相关问题_第2张图片

  axisLabel: {
              // rotate: 25, //旋转
              interval: 0, //强制显示所有label
              textStyle: {
                fontSize: 12,
                color: '#78A0C2'
              }
            },
你可能感兴趣的:(echartsvue.js)