基于vue-router vuex+Element ui+echarts+axios +mysql的后台管理系统
目录
前言
一、使用HBuilderX新建项目
二、安装依赖
三、文件创建
1.引入插件
2.APP.vue文件
3.注册路由
4.Main.vue文件
5.侧边栏实现
6顶部导航条实现
四、首页制作
1.管理用户登录信息模块
2.平台数据展示信息模块
3.用户信息表格实现
4.echarts插件使用实现
总结
前言
技术栈:vue-router vuex axios bootstrap element-ui 二次封装 mock echarts
项目搭建:项目结构分析、项目模块搭建、脚手架搭建配置、组件初始化、vuex初始化
模块分配:登录页、后台首页、用户管理页、分页处理、用户crud、路由守卫、权限管理
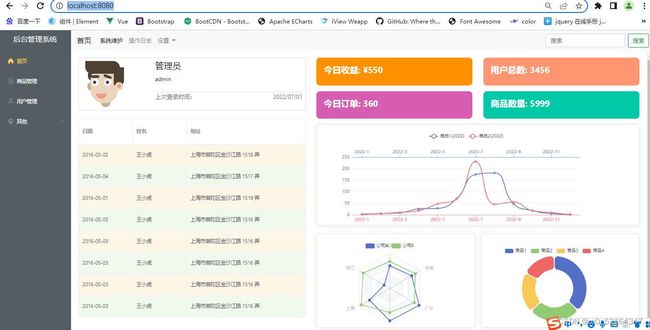
页面效果:
一、使用HBuilderX新建项目
1. 在nodejs官网下载对应需要的版本。下载地址Node.js 中文网。
2.HBuilderX新建项目,选择“vue项目”(我这里使用的是2.6版本)。
3在HBuilderX的设置——>“运行配置”——>找到“node运行配置”———>运行终端类型选择"外部命令"
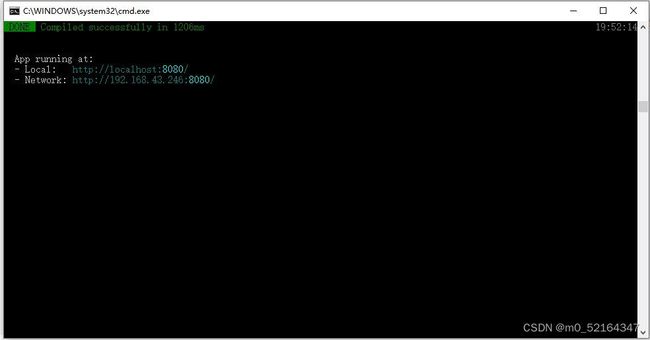
4.选择创建vue项目,右键选择“外部命令”分别执行 npm run build 和npm run server。显示下图为运行成功:
在浏览器输入http://localhost:8080/
二、安装依赖
在外部资源管理器打开项目所在路径,在地址栏输入cmd。
首次安装一般不会出现问题,如果出现 npm ERR Cannot read properties of null (reading ‘pickAlgorithm‘)报错可以尝试使用
npm cache clear --force //清除npm的缓存1.安装bootstrap依赖
npm install bootstrap2.安装vue-router依赖
npm i [email protected] 3.安装less、less-loader依赖
npm install --save-dev [email protected] [email protected]4.安装echarts 依赖
npm install echarts安装好后在项目的package.json文件下也会有相应的版本号,表示安装好了
{
  "name": "default",
  "version": "0.1.0",
  "private": true,
  "scripts": {
    "serve": "vue-cli-service serve",
    "build": "vue-cli-service build"
  },
  "dependencies": {
    "axios": "^0.27.2",
    "bootstrap-vue": "^2.22.0",
    "core-js": "^2.6.5",
    "echarts": "^5.3.3",
    "element-ui": "^2.15.9",
    "jquery": "^3.6.0",
    "popper.js": "^1.16.1",
    "vue": "^2.6.10",
    "vue-router": "^3.2.0"
  },
  "devDependencies": {
    "@vue/cli-plugin-babel": "^3.8.0",
    "@vue/cli-service": "^3.8.0",
    "less": "^3.9.0",
    "less-loader": "^4.1.0",
    "vue-template-compiler": "^2.6.10"
  }
}
三、文件创建
1.引入插件
在vue的项目下找到main.js文件:
import Vue from 'vue'
import App from './App.vue'
// 全部引入element ui组件,这里的引入可以有两种(按需引入和全部引入),按需引入可以减少文件大小
import ElementUI from 'element-ui';
import 'element-ui/lib/theme-chalk/index.css';
// 全部引入bootstrap,bootstrap是依赖于jquery的所以还需要引入juqery
import { BootstrapVue, BootstrapVueIcons } from 'bootstrap-vue'
import 'bootstrap/dist/css/bootstrap.css'
import 'bootstrap-vue/dist/bootstrap-vue.css'
import $ from 'jquery'
import 'bootstrap/dist/js/bootstrap.min'
import router from './router'
Vue.config.productionTip = false
Vue.use(ElementUI)
Vue.use(BootstrapVue)
Vue.use(BootstrapVueIcons)
Vue.prototype.$http=http
new Vue({
	router,
	render: h => h(App),

}).$mount('#app')
2.APP.vue文件
src文件下app.vue代码如下
3.注册路由
src文件下新建文件夹router,在新建index.js文件,在该文件下创建路由
1.首先导入import Vue from 'vue' ,import VueRouter from 'vue-router'插件,使用Vue.use(VueRouter );通过全局添加一些VueRouter插件,创建VueRouter实例。
2.在项目目录创建新的文件夹,名为views,改文件夹下存放路由对应的vue文件,这些vue文件作为项目侧边栏选项的页面。
view下先创建四个vue文件,分别为Home.vue、Main.vue、mall.vue、User.vue。后面就可以在index.js注册路由。
index.js:
import Vue from 'vue'
import VueRouter from 'vue-router'
import Main from '../../views/Main.vue'
import User from '../../views/User.vue'
import Home from '../../views/Home.vue'
import Mall from '../../views/Mall.vue'
Vue.use(VueRouter);
export default new VueRouter({
	mode:"history",
	base:process.env.BASE_URL,
	routes:[{
		path:"/",
		name:"Main",
		component:Main,
		children:[
			{
				path:"/user",
				name:"User",
				component:User
			},
			,{
				path:"/",
				name:"Home",
				component:Home
			},{
				path:"/mall",
				name:"Mall",
				component:Mall
			}
		]
	}
	]

});
4.Main.vue文件
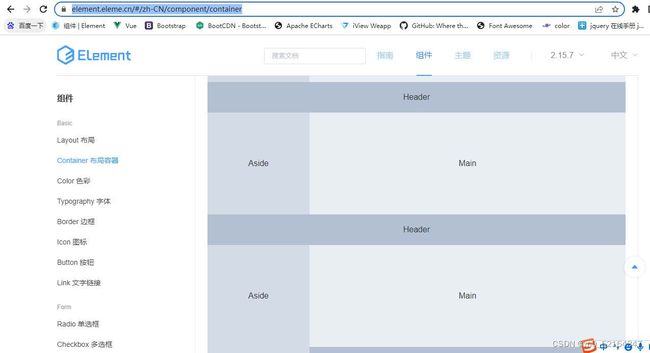
main.vue将作为整个项目的框架,跳转到element官方网站(Element - The world's most popular Vue UI framework),选择一个布局容器,找到相应代码复制到main.vue template标签下
mian.vue文件代码:
//布局容器
script标签下导入两个vue文件,后面会讲这两个vue文件的用处
5.侧边栏实现
在components文件夹下新建CommonAside.vue文件,到element官网上选择导航菜单NavMenu组件,复制框架代码。
最后,CommonAside.vue文件代码:
后台管理系统
{{item.label}}
{{item.label}}
{{i.label}}
每一个侧边导航项单击会跳转到不同的页面,vue提供了不刷新页面更新url地址,这给用户带来更好的体验。为导航项目绑定单击事件,并传递相应的path,在导航栏的json数组都事先保存了相应的路由名,后面创建注册路由的时候要与之对应,单击事件:
@click="clickMean(item)"


clickMean(item){
	this.$router.push({
	path:item.path
 })
}
6顶部导航条实现
在components文件夹下新建CommonHeader.vue文件,到bootstrap官网上选择导航条组件,复制框架代码。
CommonHeader.vue代码如下:
到这里为止Main.vue已经完成制作,但是页面显示只有侧边导航栏和顶部导航栏,内容部分还需要绑定Home.vue。
四、首页制作
首页对应的文件是Home.vue,我在做首页的时候将其分为上下两块,每一块有分左右两块,结构代码为
//管理用户登录信息模块
//平台数据展示信息模块
//用户信息表格
//折现统计图
//雷达图
//饼图
1.管理用户登录信息模块
基于bootstrap的前端框架搭建,代码:
管理员
admin
上次登录时间:
2022/07/01
2.平台数据展示信息模块
在使用element ui + bootstrap实现,代码:
今日收益: ¥550
用户总数: 3456
今日订单: 360
商品数量: 5999
3.用户信息表格实现
表格使用element的表格组件,代码:
目前数据来自script内的数组,后期将通过axios访问mysql数据库获取数据
data() {
return {
userImg: require("../src/assets/logo.png"),
tableData: [{
date: '2016-05-02',
name: '王小虎',
address: '上海市普陀区金沙江路 1518 弄'
}, {
date: '2016-05-04',
name: '王小虎',
address: '上海市普陀区金沙江路 1517 弄'
}, {
date: '2016-05-01',
name: '王小虎',
address: '上海市普陀区金沙江路 1519 弄'
}, {
date: '2016-05-03',
name: '王小虎',
address: '上海市普陀区金沙江路 1516 弄'
}, {
date: '2016-05-03',
name: '王小虎',
address: '上海市普陀区金沙江路 1516 弄'
}, {
date: '2016-05-03',
name: '王小虎',
address: '上海市普陀区金沙江路 1516 弄'
}, {
date: '2016-05-03',
name: '王小虎',
address: '上海市普陀区金沙江路 1516 弄'
}, {
date: '2016-05-03',
name: '王小虎',
address: '上海市普陀区金沙江路 1516 弄'
}]
}
},
4.echarts插件使用实现
echarts一款基于JavaScript的数据可视化图表库,提供直观,生动,可交互,可个性化定制的数据可视化图表。ECharts最初由百度团队开源,并于2018年初捐赠给Apache基金会,成为ASF孵化级项目。官网(Apache ECharts)
数据源:
mounted(){
// 折线图数据源
const colors = ['#5470C6', '#EE6666'];
const option = {
color: colors,
tooltip: {
trigger: 'none',
axisPointer: {
type: 'cross'
}
},
legend: {},
grid: {
top: 70,
bottom: 50
},
xAxis: [
{
type: 'category',
axisTick: {
alignWithLabel: true
},
axisLine: {
onZero: false,
lineStyle: {
color: colors[1]
}
},
axisPointer: {
label: {
formatter: function (params) {
return (
'商品2 ' +
params.value +
(params.seriesData.length ? ':' + params.seriesData[0].data : '')
);
}
}
},
// prettier-ignore
data: ['2022-1', '2022-2', '2022-3', '2022-4', '2022-5', '2022-6', '2022-7', '2022-8', '2022-9', '2022-10', '2022-11', '2022-12']
},
{
type: 'category',
axisTick: {
alignWithLabel: true
},
axisLine: {
onZero: false,
lineStyle: {
color: colors[0]
}
},
axisPointer: {
label: {
formatter: function (params) {
return (
'商品1 ' +
params.value +
(params.seriesData.length ? ':' + params.seriesData[0].data : '')
);
}
}
},
// prettier-ignore
data: ['2022-1', '2022-2', '2022-3', '2022-4', '2022-5', '2022-6', '2022-7', '2022-8', '2022-9', '2022-10', '2022-11', '2022-12']
}
],
yAxis: [
{
type: 'value'
}
],
series: [
{
name: '商品1(2022)',
type: 'line',
xAxisIndex: 1,
smooth: true,
emphasis: {
focus: 'series'
},
data: [
2.6, 5.9, 9.0, 26.4, 28.7, 70.7, 175.6, 182.2, 48.7, 18.8, 6.0, 2.3
]
},
{
name: '商品2(2022)',
type: 'line',
smooth: true,
emphasis: {
focus: 'series'
},
data: [
3.9, 5.9, 11.1, 18.7, 48.3, 69.2, 231.6, 46.6, 55.4, 18.4, 10.3, 0.7
]
}
]
}
const E =echarts.init(this.$refs.echarts1)
E.setOption(option)
const option1 = {
legend: {
data: ['公司A', '公司B']
},
radar: {
// shape: 'circle',
indicator: [
{ name: '福建', max: 6500 },
{ name: '浙江', max: 16000 },
{ name: '上海', max: 30000 },
{ name: '辽宁', max: 38000 },
{ name: '广东', max: 52000 },
{ name: '安徽', max: 25000 }
]
},
series: [
{
name: 'Budget vs spending',
type: 'radar',
data: [
{
value: [4200, 3000, 20000, 35000, 50000, 18000],
name: '公司A'
},
{
value: [5000, 14000, 28000, 26000, 42000, 21000],
name: '公司B'
}
]
}
]
}
const E1 =echarts.init(this.$refs.echarts2)
E1.setOption(option1)
const option2 = {
tooltip: {
trigger: 'item'
},
legend: {
top: '5%',
left: 'center'
},
series: [
{
name: 'Access From',
type: 'pie',
radius: ['40%', '70%'],
avoidLabelOverlap: false,
itemStyle: {
borderRadius: 10,
borderColor: '#fff',
borderWidth: 2
},
label: {
show: false,
position: 'center'
},
emphasis: {
label: {
show: true,
fontSize: '40',
fontWeight: 'bold'
}
},
labelLine: {
show: false
},
data: [
{ value: 1048, name: '商品1' },
{ value: 735, name: '商品2' },
{ value: 580, name: '商品3' },
{ value: 484, name: '商品4' }
]
}
]
}
const E2 =echarts.init(this.$refs.echarts3)
E2.setOption(option2)
}
,
总结
以上就是我7.1号具体的工作内容,完成项目的百分之20左右,本人学习vue时间不长,最近才开始认真的接触所以还存在许多漏洞,请多多指正。本文仅仅简单介绍了vue的使用,而市场提供了大量前端ui组件框架,能使我们快速便捷地搭建前端的页面。
你可能感兴趣的:(前端,vue.js,ui,echarts,mysql,前端)


