目前的商业工具如水晶报表,
ActiveReport
等,都提供了灵活,强大的功能,但是对于比较特殊化的表格,特别是国内的一些应用,都是一个个的格子组成的,这样要是用线来一根根画就比较麻烦,但是这类工具还都不提供表格化的报表布局定义方式。一个很好的选择是
VS2005
的客户端报表(
RDLC
),但是在某几个方面还是不够灵活,例如,灵活性有限制,要想自己编码实现一些复杂逻辑还是有困难;要
VS2005
,对于一些还在使用
VS2003
的项目就只有眼馋的份了。用
Excel
来实现,优点在于页面布局设计灵活,同时使用代码来操作数据要更灵活,更精确。
下面是一个简单的例子,打开一个定义好的
Excel
文件,这个文件是作为报表的模板,然后向模板的指定格子里填充数据,形成一个报表,在
web
方式下可以按照指定的命名方式在服务器上生成一个
excel
文件,之后传送到客户端,由客户端启动
excel
进行打印。
Excel.Application m_objExcel = null;
Excel._Workbook m_objBook = null;
Excel.Sheets m_objSheets = null;
Excel._Worksheet m_objSheet = null;
Excel.Range m_objRange = null;
object
m_objOpt = System.Reflection.Missing.Value;
try
{
m_objExcel = new Excel.Application();
m_objBook = m_objExcel.Workbooks.Open("z:\\Book1.xls", m_objOpt, m_objOpt, m_objOpt, m_objOpt, m_objOpt, m_objOpt, m_objOpt, m_objOpt, m_objOpt, m_objOpt, m_objOpt, m_objOpt);
m_objSheets = (Excel.Sheets)m_objBook.Worksheets;
m_objSheet = (Excel._Worksheet)(m_objSheets.get_Item(1));
string[] info = new string[5] { "Cure", "26", "dahuzizyd.cnblogs.com", "
汉
"
, "
按时
?
放奥斯丁奥斯丁非是否奥斯丁非
"
};
m_objRange = m_objSheet.get_Range("B1", m_objOpt);
m_objRange.Value = info[0];
m_objRange = m_objSheet.get_Range("E1", m_objOpt);
m_objRange.Value = info[1];
m_objRange = m_objSheet.get_Range("B2", m_objOpt);
m_objRange.Value = info[2];
m_objRange = m_objSheet.get_Range("E2", m_objOpt);
m_objRange.Value = info[3];
m_objRange = m_objSheet.get_Range("A3", m_objOpt);
m_objRange.Value = info[4];
m_objExcel.DisplayAlerts = false;
m_objBook.SaveAs("z:\\Book2.xls", m_objOpt, m_objOpt,
m_objOpt, m_objOpt, m_objOpt, Excel.XlSaveAsAccessMode.xlNoChange,
m_objOpt, m_objOpt, m_objOpt, m_objOpt);
}
catch
(Exception ex)
{
MessageBox.Show(ex.Message);
}
finally
{
m_objBook.Close(m_objOpt, m_objOpt, m_objOpt);
m_objExcel.Workbooks.Close();
m_objExcel.Quit();
System.Runtime.InteropServices.Marshal.ReleaseComObject(m_objBook);
System.Runtime.InteropServices.Marshal.ReleaseComObject(m_objExcel);
m_objBook = null;
m_objExcel = null;
GC.Collect();
}
可以看到,使用
Excel
要进行一部分的编码,好在这部分还不太复杂,但是最大的问题就在于当报表需求变更时,要重新编译部署,而且当格子特别多的时候,要这样硬编码还是挺痛苦的一件事。不过使用
Excel
毕竟给我们提供了一种选择,可以在开发时对多种方案权衡利弊,使用最适合项目的。
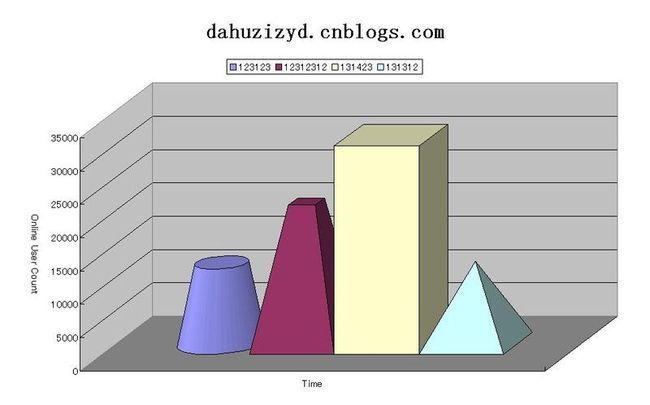
下面的代码使用一个现有的统计图
Excel
文件,加载这个文件,设置某一项的值和统计图的表示方式,然后保存到另一个
Excel
文件里。如果是
VS2005+
Office2003
,也可以选择使用
Visual Studio Tools for Office
来作。
Excel.Application m_objExcel = null;
Excel._Workbook m_objBook = null;
Excel._Chart m_objChart = null;
Excel.ChartGroup m_objChartGroup = null;
Excel.Series m_objSeries = null;
object
m_objOpt = System.Reflection.Missing.Value;
try
{
m_objExcel = new Excel.Application();
m_objBook = m_objExcel.Workbooks.Open("z:\\Book11.xls", m_objOpt, m_objOpt, m_objOpt, m_objOpt, m_objOpt, m_objOpt, m_objOpt, m_objOpt, m_objOpt, m_objOpt, m_objOpt, m_objOpt);
m_objChart = (Excel._Chart)m_objExcel.Charts.get_Item(1);
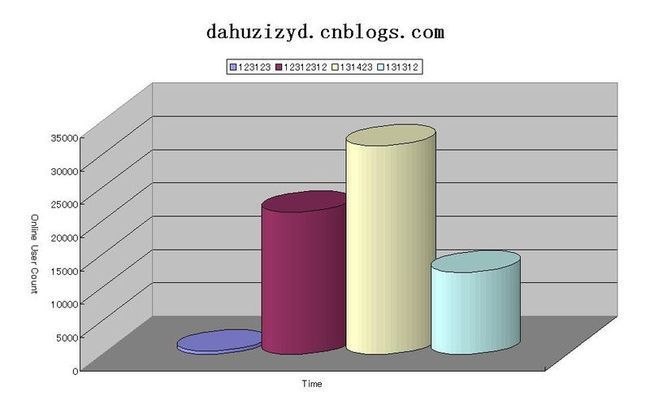
m_objChart.BarShape = Excel.XlBarShape.xlCylinder;
m_objChartGroup = (Excel.ChartGroup)m_objChart.ChartGroups(1);
m_objSeries = (Excel.Series)m_objChartGroup.SeriesCollection(1);
m_objSeries.Values = 456;
m_objExcel.DisplayAlerts = false;
m_objBook.SaveAs("z:\\Book2.xls", m_objOpt, m_objOpt,
m_objOpt, m_objOpt, m_objOpt, Excel.XlSaveAsAccessMode.xlNoChange,
m_objOpt, m_objOpt, m_objOpt, m_objOpt);
}
catch
(Exception ex)
{
MessageBox.Show(ex.Message);
}
finally
{
m_objBook.Close(m_objOpt, m_objOpt, m_objOpt);
m_objExcel.Workbooks.Close();
m_objExcel.Quit();
System.Runtime.InteropServices.Marshal.ReleaseComObject(m_objBook);
System.Runtime.InteropServices.Marshal.ReleaseComObject(m_objExcel);
m_objBook = null;
m_objExcel = null;
GC.Collect();
this.Close();
}
源Excel文件中的统计图:
经过代码处理后保存的统计图:
有的
Web
项目选用
Excel
作为报表方案,在服务器端生成
Excel
文件,然后传送到客户端,由客户端进行打印。在国内的环境下,相对
PDF
方式,
Excel
的安装率应该比
pdf
阅读器的安装率要高,同时,微软也为
C#
操作
Excel
提供了完备的接口,虽然
ZedGraph
和其他的商业报表工具生成的统计图也很好,但是人家微软毕竟是大品牌,值得信赖。
本文介绍使用
C#
调用
Excel
来生成统计图(
Chart
)的以及
Chart
图中各部分控制的一些方法。
首先当然要添加对
Excel
的引用,然后需要定义几个要用到的
Excel
对象:
Excel.Application ThisApplication = null;
Excel.Workbooks m_objBooks = null;
Excel._Workbook ThisWorkbook = null;
Excel.Worksheet xlSheet = null;
在创建一个新的
_WorkBook
对象的时候,默认的会含有
3
个
Sheet
,所以为了显示清晰,将多余的
Sheet
都删掉:
private
void DeleteSheet()
{
foreach (Excel.Worksheet ws in ThisWorkbook.Worksheets)
if (ws != ThisApplication.ActiveSheet)
{
ws.Delete();
}
foreach (Excel.Chart cht in ThisWorkbook.Charts)
cht.Delete();
}
再下来需要添加用来给
Chart
提供数据的
Sheet
:
private
void AddDatasheet()
{
xlSheet = (Excel.Worksheet)ThisWorkbook.
Worksheets.Add(Type.Missing, ThisWorkbook.ActiveSheet,
Type.Missing, Type.Missing);
xlSheet.Name = "
数据
"
;
}
生成
Chart
用到的数据,因为是演示,所以这里使用生成随机数的方法来替代从数据库中提取数据。
private
void LoadData()
{
Random ran = new Random();
for (int i = 1; i <= 12; i++)
{
xlSheet.Cells[i, 1] = i.ToString() + "
月
"
;
xlSheet.Cells[i, 2] = ran.Next(2000).ToString();
}
}
好了,到此,准备工作全部已经就绪,下面要进行
Chart
的生成设置部分了:
生成一个统计图对象:
Excel.Chart xlChart = (Excel.Chart)ThisWorkbook.Charts.
Add(Type.Missing, xlSheet, Type.Missing, Type.Missing);
设定数据来源:
Excel.Range cellRange = (Excel.Range)xlSheet.Cells[1, 1];
通过向导生成
Chart
:
xlChart.ChartWizard(cellRange.CurrentRegion,
Excel.XlChartType.xl3DColumn, Type.Missing,
Excel.XlRowCol.xlColumns,1, 0, true ,
"
访问量比较
(dahuzizyd.cnblogs.com)"
, "
月份
"
, "
访问量
"
,
"");
到此,
Chart
的生成就完成了,貌似比较简单,下面我们对其作一些设置,好更漂亮些。
设置统计图
Sheet
的名称:
xlChart.Name = "
统计
"
;
现在的统计图只有一个组,他们会显示成一样的颜色,我们来让
12
个
Bar
都显示不同的颜色:
Excel.ChartGroup grp = (Excel.ChartGroup)xlChart.ChartGroups(1);
grp.GapWidth = 20;
grp.VaryByCategories = true;
现在
Chart
的条目的显示形状是
Box
,我们让它们变成圆柱形,并给它们显示加上数据标签:
Excel.Series s = (Excel.Series)grp.SeriesCollection(1);
s.BarShape = XlBarShape.xlCylinder;
s.HasDataLabels = true;
下面再来设置统计图的标题和图例的显示:
xlChart.Legend.Position = XlLegendPosition.xlLegendPositionTop;
xlChart.ChartTitle.Font.Size = 24;
xlChart.ChartTitle.Shadow = true;
xlChart.ChartTitle.Border.LineStyle = Excel.XlLineStyle.xlContinuous;
最后设置两个轴的属性,
Excel.XlAxisType.xlValue
对应的是
Y
轴,
Excel.XlAxisType.xlCategory
对应的是
X
轴:
Excel.Axis valueAxis = (Excel.Axis)xlChart.Axes(Excel.XlAxisType.xlValue, XlAxisGroup.xlPrimary);
valueAxis.AxisTitle.Orientation = -90;
Excel.Axis categoryAxis = (Excel.Axis)xlChart.Axes(Excel.XlAxisType.xlCategory, XlAxisGroup.xlPrimary);
categoryAxis.AxisTitle.Font.Name = "MS UI Gothic";
到此,一切就绪了,下面要生成
Chart
,并将其存为一个
Excel
文件:
 try
try


 {
{
 ThisApplication = new Excel.Application();
m_objBooks = (Excel.Workbooks)ThisApplication.Workbooks;
ThisWorkbook = (Excel._Workbook)(m_objBooks.Add(Type.Missing));
ThisApplication.DisplayAlerts = false;
this.DeleteSheet();
this.AddDatasheet();
this.LoadData();
CreateChart();
ThisWorkbook.SaveAs("z:\\Book2.xls", Type.Missing, Type.Missing,
Type.Missing, Type.Missing, Type.Missing, Excel.XlSaveAsAccessMode.xlNoChange,
Type.Missing, Type.Missing, Type.Missing, Type.Missing);
 }
}
catch
(Exception ex)
{
MessageBox.Show(ex.Message);
}
finally
{
ThisWorkbook.Close(Type.Missing, Type.Missing, Type.Missing);
ThisApplication.Workbooks.Close();
ThisApplication.Quit();
System.Runtime.InteropServices.Marshal.ReleaseComObject(ThisWorkbook);
System.Runtime.InteropServices.Marshal.ReleaseComObject(ThisApplication);
ThisWorkbook = null;
ThisApplication = null;
GC.Collect();
this.Close();
}
运行你的程序,打开生成的
Excel
文件,最终生成的
Chart
应该像这样:

完成了
Chart
的生成,但是上面对于每个月只有一项数据,如果我想显示多项呢,例如显示每个月两个页面的范围量的对比。方法很简单,只要再多生成一组数据就可以了,我们修改下
LoadData
方法:
private
void LoadData()
{
Random ran = new Random();
for (int i = 1; i <= 12; i++)
{
xlSheet.Cells[i, 1] = i.ToString() + "
月
"
;
xlSheet.Cells[i, 2] = ran.Next(2000).ToString();
xlSheet.Cells[i,
3
] = ran.Next(
1500
).ToString();
}
}
再次运行程序,生成
Chart
看看,应该像下面的效果:

可以看到,两组数据以不同的形状显示,同时,图例部分也不再显示
1
-
12
月共
12
项,而是显示两项,这是因为在上面的代码中我们设置了
ChartGroup
的
VaryByCategories
属性:
grp.VaryByCategories = true;
当我们有两个以上的组时,这一项就失效了。
在用
C#
操作
Excel
的时候,恐怕最大的困难就在于不知道
Excel
提供的各个对象,以及它们的属性,方法等信息,好在
MSDN
里有关于
Excel
的接口说明-
Excel Primary Interop Assembly Reference
,参照这些,相信很快就能上手了。
最后是
完整代码:
private void button4_Click(object sender, EventArgs e)
{
try

 {
{
ThisApplication = new Excel.Application();
m_objBooks = (Excel.Workbooks)ThisApplication.Workbooks;
ThisWorkbook = (Excel._Workbook)(m_objBooks.Add(Type.Missing));
ThisApplication.DisplayAlerts = false;
this.DeleteSheet();
this.AddDatasheet();
this.LoadData();
CreateChart();
ThisWorkbook.SaveAs("z:\\Book2.xls", Type.Missing, Type.Missing,
Type.Missing, Type.Missing, Type.Missing, Excel.XlSaveAsAccessMode.xlNoChange,
Type.Missing, Type.Missing, Type.Missing, Type.Missing);
 }
}
catch (Exception ex)
{
MessageBox.Show(ex.Message);
}
finally
{
ThisWorkbook.Close(Type.Missing, Type.Missing, Type.Missing);
ThisApplication.Workbooks.Close();
ThisApplication.Quit();
System.Runtime.InteropServices.Marshal.ReleaseComObject(ThisWorkbook);
System.Runtime.InteropServices.Marshal.ReleaseComObject(ThisApplication);
ThisWorkbook = null;
ThisApplication = null;
GC.Collect();
this.Close();
}
}
Excel.Application ThisApplication = null;
Excel.Workbooks m_objBooks = null;
Excel._Workbook ThisWorkbook = null;
Excel.Worksheet xlSheet = null;
/**//// <summary>
/// 用生成的随机数作数据
/// </summary>
private void LoadData()
{
Random ran = new Random();
for (int i = 1; i <= 12; i++)
{
xlSheet.Cells[i, 1] = i.ToString() + "月";
xlSheet.Cells[i, 2] = ran.Next(2000).ToString();
}
}
/**//// <summary>
/// 删除多余的Sheet
/// </summary>
private void DeleteSheet()
{
foreach (Excel.Worksheet ws in ThisWorkbook.Worksheets)
if (ws != ThisApplication.ActiveSheet)
{
ws.Delete();
}
foreach (Excel.Chart cht in ThisWorkbook.Charts)
cht.Delete();
}
/**//// <summary>
/// 创建一个Sheet,用来存数据
/// </summary>
private void AddDatasheet()
{
xlSheet = (Excel.Worksheet)ThisWorkbook.
Worksheets.Add(Type.Missing, ThisWorkbook.ActiveSheet,
Type.Missing, Type.Missing);
xlSheet.Name = "数据";
}
/**//// <summary>
/// 创建统计图
/// </summary>
private void CreateChart()
{
Excel.Chart xlChart = (Excel.Chart)ThisWorkbook.Charts.
Add(Type.Missing, xlSheet, Type.Missing, Type.Missing);
Excel.Range cellRange = (Excel.Range)xlSheet.Cells[1, 1];
xlChart.ChartWizard(cellRange.CurrentRegion,
Excel.XlChartType.xl3DColumn, Type.Missing,
Excel.XlRowCol.xlColumns,1, 0, true ,
"访问量比较(dahuzizyd.cnblogs.com)", "月份", "访问量",
"");
xlChart.Name = "统计";
Excel.ChartGroup grp = (Excel.ChartGroup)xlChart.ChartGroups(1);
grp.GapWidth = 20;
grp.VaryByCategories = true;
Excel.Series s = (Excel.Series)grp.SeriesCollection(1);
s.BarShape = XlBarShape.xlCylinder;
s.HasDataLabels = true;
xlChart.Legend.Position = XlLegendPosition.xlLegendPositionTop;
xlChart.ChartTitle.Font.Size = 24;
xlChart.ChartTitle.Shadow = true;
xlChart.ChartTitle.Border.LineStyle = Excel.XlLineStyle.xlContinuous;
Excel.Axis valueAxis = (Excel.Axis)xlChart.Axes(Excel.XlAxisType.xlValue, XlAxisGroup.xlPrimary);
valueAxis.AxisTitle.Orientation = -90;
Excel.Axis categoryAxis = (Excel.Axis)xlChart.Axes(Excel.XlAxisType.xlCategory, XlAxisGroup.xlPrimary);
categoryAxis.AxisTitle.Font.Name = "MS UI Gothic";
}
Trackback: http://tb.blog.csdn.net/TrackBack.aspx?PostId=1873955
在用
Excel
作报表的时候,可能会碰到分页的情况,这样就要分成多个
Sheet
显示,如果要在每页都保留表头,就需要将第一页作为模板设计的表头部分拷贝到其他的
Sheet
上,这时就要用用到
Excel
中的单元格拷贝。
下面的代码说明如何一个
Sheet
上的选定内容拷贝到另一个
Sheet
上:
ThisApplication = new Excel.Application();
ThisWorkbook = ThisApplication.Workbooks.Open("z:\\Book1.xls", Type.Missing, Type.Missing, Type.Missing, Type.Missing, Type.Missing, Type.Missing, Type.Missing, Type.Missing, Type.Missing, Type.Missing, Type.Missing, Type.Missing);
ThisApplication.DisplayAlerts = false;
xlSheet = (Excel.Worksheet)ThisWorkbook.Worksheets.get_Item(1);
Excel.Range range = xlSheet.get_Range("A1", Type.Missing);
range.Value = "123";
Excel.Worksheet sheet1 = (Excel.Worksheet)ThisWorkbook.Worksheets.get_Item(2);
Excel.Range range1 = sheet1.get_Range("B1", Type.Missing);
range.Copy(range1);
ThisWorkbook.SaveAs("z:\\Book2.xls", Type.Missing, Type.Missing,
Type.Missing, Type.Missing, Type.Missing, Excel.XlSaveAsAccessMode.xlNoChange,
Type.Missing, Type.Missing, Type.Missing, Type.Missing);
可以看到,核心的代码是很简单的,就是选定一个源区域,然后指定另一个目标区域,调用源区域的
Copy
方法将内容整个复制到目标区域,但是你会发现是连单元格的格式等属性一并拷贝过去的,如果要只拷贝单元格中的文本呢?那就要用到
windows
剪贴板了:
xlSheet = (Excel.Worksheet)ThisWorkbook.Worksheets.get_Item(1);
Excel.Range range = xlSheet.get_Range("A1", Type.Missing);
range.Value = "123";
System.Windows.Forms.Clipboard.SetDataObject(range.Value.ToString());
Excel.Worksheet sheet1 = (Excel.Worksheet)ThisWorkbook.Worksheets.get_Item(2);
Excel.Range range1 = sheet1.get_Range("B1", Type.Missing);
sheet1.Paste(range1, false);
要注意的是,这种方式只能选一个单元格,复制一个,不能选定一批单元格进行复制。
上面的例子只给出了主要部分的代码,其他的像销毁
Excel
进程等操作请参考前面的几篇
Excel
作报表的随笔。
Trackback: http://tb.blog.csdn.net/TrackBack.aspx?PostId=1873962
在
Excel
中,行和列实际上仍然是
Range
,只不过取得行和列的方法和前面几篇随笔出现的有点不同,要使用
Worksheet
的
Rows
和
Columns
属性的
get_Item
方法,下面是例子代码,演示了怎样选中行,并且在行之间复制数据,和插入行:
ThisApplication = new Excel.Application();
ThisWorkbook = ThisApplication.Workbooks.Open("z:\\Book1.xls", Type.Missing, Type.Missing, Type.Missing, Type.Missing, Type.Missing, Type.Missing, Type.Missing, Type.Missing, Type.Missing, Type.Missing, Type.Missing, Type.Missing);
ThisApplication.DisplayAlerts = false;
xlSheet = (Excel.Worksheet)ThisWorkbook.Worksheets.get_Item(1);
//Excel.Range range = xlSheet.get_Range("G4",Type.Missing);
Excel.Range range = (Excel.Range)xlSheet.Rows.get_Item(18, Type.Missing);
Excel.Range range1 = (Excel.Range)xlSheet.Rows.get_Item(19, Type.Missing);
range.Value = "123";
range.Copy(range1);
range1.Rows.Insert(XlInsertShiftDirection.xlShiftDown);
ThisWorkbook.SaveAs("z:\\Book2.xls", Type.Missing, Type.Missing,
Type.Missing, Type.Missing, Type.Missing, Excel.XlSaveAsAccessMode.xlNoChange,
Type.Missing, Type.Missing, Type.Missing, Type.Missing);
关于
Excel
进程的释放,前面几篇随笔已经有了,这里就不再重复了。
Trackback: http://tb.blog.csdn.net/TrackBack.aspx?PostId=1873969
在用
Excel
作报表的时候,可能需要操作单元格的边框和填充颜色和纹理等操作,下面的代码说明如何设置选中的单元格的填充纹理和边框
try
{
ThisApplication = new Excel.Application();
ThisWorkbook = ThisApplication.Workbooks.Open("z:\\Book1.xls", Type.Missing, Type.Missing, Type.Missing, Type.Missing, Type.Missing, Type.Missing, Type.Missing, Type.Missing, Type.Missing, Type.Missing, Type.Missing, Type.Missing);
ThisApplication.DisplayAlerts = false;
xlSheet = (Excel.Worksheet)ThisWorkbook.Worksheets.get_Item(1);
Excel.Range range = xlSheet.get_Range("G4","H5");
range.Value = "123";
Excel.Style st = ThisWorkbook.Styles.Add("PropertyBorder", Type.Missing);
range.Interior.Pattern = Excel.XlPattern.xlPatternCrissCross;
range.Borders.Weight = 2;
range.Borders.get_Item(XlBordersIndex.xlEdgeRight).LineStyle = Excel.XlLineStyle.xlContinuous;
range.Borders.get_Item(XlBordersIndex.xlEdgeBottom).LineStyle = Excel.XlLineStyle.xlContinuous;
range.Borders.get_Item(XlBordersIndex.xlEdgeTop).LineStyle = Excel.XlLineStyle.xlContinuous;
range.Borders.get_Item(XlBordersIndex.xlDiagonalDown).LineStyle = Excel.XlLineStyle.xlLineStyleNone;
range.Borders.get_Item(XlBordersIndex.xlDiagonalUp).LineStyle = Excel.XlLineStyle.xlLineStyleNone;
range.Borders.get_Item(XlBordersIndex.xlInsideHorizontal).LineStyle = Excel.XlLineStyle.xlLineStyleNone;
range.Borders.get_Item(XlBordersIndex.xlInsideVertical).LineStyle = Excel.XlLineStyle.xlLineStyleNone;
range.Borders.get_Item(XlBordersIndex.xlEdgeLeft).LineStyle = Excel.XlLineStyle.xlDot;
range.Borders.get_Item(XlBordersIndex.xlEdgeLeft).Color = System.Drawing.ColorTranslator.ToOle(Color.Red);
ThisWorkbook.SaveAs("z:\\Book2.xls", Type.Missing, Type.Missing,
Type.Missing, Type.Missing, Type.Missing, Excel.XlSaveAsAccessMode.xlNoChange,
Type.Missing, Type.Missing, Type.Missing, Type.Missing);
}
catch
(Exception ex)
{
MessageBox.Show(ex.Message);
}
finally
{
ThisWorkbook.Close(Type.Missing, Type.Missing, Type.Missing);
ThisApplication.Workbooks.Close();
ThisApplication.Quit();
System.Runtime.InteropServices.Marshal.ReleaseComObject(ThisWorkbook);
System.Runtime.InteropServices.Marshal.ReleaseComObject(ThisApplication);
ThisWorkbook = null;
ThisApplication = null;
GC.Collect();
this.Close();
}
在Excel中,如果某个单元格的内容是数字,且比较长,默认情况下,会变为科学计数发表示,例如:123456789123456000会被表示为1.2345E+17,为了能够将数字按照普通的格式完全表示,就需要设置单元格的属性 ,下面是例子代码:
Excel.Application m_objExcel
=
null
;
Excel._Workbook m_objBook
=
null
;
Excel.Sheets m_objSheets
=
null
;
Excel._Worksheet m_objSheet
=
null
;
Excel.Range m_objRange
=
null
;
object
m_objOpt
=
System.Reflection.Missing.Value;
try
{
m_objExcel = new Excel.Application();
m_objBook = m_objExcel.Workbooks.Open("e:\\1.xls", m_objOpt, m_objOpt, m_objOpt,
m_objOpt, m_objOpt, m_objOpt, m_objOpt, m_objOpt, m_objOpt, m_objOpt,
m_objOpt, m_objOpt, m_objOpt, m_objOpt);
m_objSheets = (Excel.Sheets)m_objBook.Worksheets;
m_objSheet = (Excel._Worksheet)(m_objSheets.get_Item(1));
m_objRange = m_objSheet.get_Range("A1", m_objOpt);
m_objRange.NumberFormatLocal = "#";
m_objBook.SaveAs("e:\\22.xls", m_objOpt, m_objOpt,
m_objOpt, m_objOpt, m_objOpt, Excel.XlSaveAsAccessMode.xlNoChange,
m_objOpt, m_objOpt, m_objOpt, m_objOpt, m_objOpt);
}
catch
(Exception ex)
{
MessageBox.Show(ex.Message);
}
finally
{
m_objBook.Close(m_objOpt, m_objOpt, m_objOpt);
m_objExcel.Workbooks.Close();
m_objExcel.Quit();
System.Runtime.InteropServices.Marshal.ReleaseComObject(m_objBook);
System.Runtime.InteropServices.Marshal.ReleaseComObject(m_objExcel);
m_objBook = null;
m_objExcel = null;
GC.Collect();
}
本文演示一个简单的办法,并使用程序将一个dataset中的内容填充到指定的格子中,目的是尽可能的通用,从而避免C#代码必须知道Excel文件中字段和内容的位置的情况。
先制作一个简单的Excel文件作为模板,为了防止要填充的Cell中的内容和标题的内容一样,所以要填充内容的Cell中的内容是“$” + 字段名(要和DataTable中的列名一致),效果如图:

创建一个Winform程序,给窗体上添加两个按钮,代码分别为:
创建Xml:
private
void
button1_Click(
object
sender, EventArgs e)
{
DataColumn dcName = new DataColumn("name", typeof(string));
DataColumn dcAge = new DataColumn("age", typeof(int));
DataColumn dcMemo = new DataColumn("memo", typeof(string));
DataTable dt = new DataTable();
dt.Columns.Add(dcName);
dt.Columns.Add(dcAge);
dt.Columns.Add(dcMemo);
DataRow dr = dt.NewRow();
dr["name"] = "dahuzizyd";
dr["age"] = "20";
dr["memo"] = "dahuzizyd.cnblogs.com";
dt.Rows.Add(dr);
dt.AcceptChanges();
DataSet ds = new DataSet();
ds.Tables.Add(dt);
ds.WriteXml(Application.StartupPath +"\\ExcelBindingXml.xml");
}
提取xml并且加载到Excel模板上,再另存:
private
void
button2_Click(
object
sender, EventArgs e)
{
DataSet ds = new DataSet();
ds.ReadXml(Application.StartupPath + "\\ExcelBindingXml.xml");
Excel.Application m_objExcel = null;
Excel._Workbook m_objBook = null;
Excel.Sheets m_objSheets = null;
Excel._Worksheet m_objSheet = null;
Excel.Range m_objRange = null;
object m_objOpt = System.Reflection.Missing.Value;
try
{
m_objExcel = new Excel.Application();
m_objBook = m_objExcel.Workbooks.Open(Application.StartupPath + "\\ExcelTemplate.xls", m_objOpt, m_objOpt, m_objOpt, m_objOpt, m_objOpt, m_objOpt, m_objOpt, m_objOpt, m_objOpt, m_objOpt, m_objOpt, m_objOpt, m_objOpt, m_objOpt);
m_objSheets = (Excel.Sheets)m_objBook.Worksheets;
m_objSheet = (Excel._Worksheet)(m_objSheets.get_Item(1));
foreach (DataRow dr in ds.Tables[0].Rows)
{
for (int col = 0; col < ds.Tables[0].Columns.Count; col++)
{
for (int excelcol = 1; excelcol < 8; excelcol++)
{
for (int excelrow = 1; excelrow < 5; excelrow++)
{
string excelColName = ExcelColNumberToColText(excelcol);
m_objRange = m_objSheet.get_Range(excelColName + excelrow.ToString(), m_objOpt);
if ( m_objRange.Text.ToString().Replace("$","") == ds.Tables[0].Columns[col].ColumnName )
{
m_objRange.Value2 = dr[col].ToString();
}
}
}
}
}
m_objExcel.DisplayAlerts = false;
m_objBook.SaveAs(Application.StartupPath + "\\ExcelBindingXml.xls", m_objOpt, m_objOpt,
m_objOpt, m_objOpt, m_objOpt, Excel.XlSaveAsAccessMode.xlNoChange,
m_objOpt, m_objOpt, m_objOpt, m_objOpt, m_objOpt);
}
catch (Exception ex)
{
MessageBox.Show(ex.Message);
}
finally
{
m_objBook.Close(m_objOpt, m_objOpt, m_objOpt);
m_objExcel.Workbooks.Close();
m_objExcel.Quit();
System.Runtime.InteropServices.Marshal.ReleaseComObject(m_objBook);
System.Runtime.InteropServices.Marshal.ReleaseComObject(m_objExcel);
m_objBook = null;
m_objExcel = null;
GC.Collect();
}
}
下面是一个辅助函数,主要是将整数的列序号转换到Excel用的以字母表示的列号,Excel最大列数为255。
private
string
ExcelColNumberToColText(
int
colNumber)
{
string colText = "";
int colTextLength = colNumber / 26;
int colTextLast = colNumber % 26;
if (colTextLast != 0)
{
switch (colTextLength)
{
case 0: break;
case 1: colText = "A"; break;
case 2: colText = "B"; break;
case 3: colText = "C"; break;
case 4: colText = "D"; break;
case 5: colText = "E"; break;
case 6: colText = "F"; break;
case 7: colText = "G"; break;
case 8: colText = "H"; break;
case 9: colText = "I"; break;
default: break;
}
}
else
{
switch (colTextLength)
{
case 1: colText = ""; break;
case 2: colText = "A"; break;
case 3: colText = "B"; break;
case 4: colText = "C"; break;
case 5: colText = "D"; break;
case 6: colText = "E"; break;
case 7: colText = "F"; break;
case 8: colText = "G"; break;
case 9: colText = "H"; break;
default: break;
}
}
switch (colTextLast)
{
case 0:colText = colText + "Z"; break;
case 1: colText = colText + "A"; break;
case 2: colText = colText + "B"; break;
case 3: colText = colText + "C"; break;
case 4: colText = colText + "D"; break;
case 5: colText = colText + "E"; break;
case 6: colText = colText + "F"; break;
case 7: colText = colText + "G"; break;
case 8: colText = colText + "H"; break;
case 9: colText = colText + "I"; break;
case 10: colText = colText + "J"; break;
case 11: colText = colText + "K"; break;
case 12: colText = colText + "L"; break;
case 13: colText = colText + "M"; break;
case 14: colText = colText + "N"; break;
case 15: colText = colText + "O"; break;
case 16: colText = colText + "P"; break;
case 17: colText = colText + "Q"; break;
case 18: colText = colText + "R"; break;
case 19: colText = colText + "S"; break;
case 20: colText = colText + "T"; break;
case 21: colText = colText + "U"; break;
case 22: colText = colText + "V"; break;
case 23: colText = colText + "W"; break;
case 24: colText = colText + "X"; break;
case 25: colText = colText + "Y"; break;
default: break;
}
return colText;
}
运行完成后,生成的Excel如下图:
