【python numpy】a.cumsum()、np.interp()、np.maximum.accumulate()、np.trapz()
目录
- 一、a.cumsum()
- 二、np.interp()
- 三、np.maximum.accumulate
- 四、np.trapz
一、a.cumsum()
a.cumsum(axis=None, dtype=None, out=None)
参数
a :数组
axis: 轴索引,整型,若a为n维数组,则axis的取值范围为[0,n-1]
dtype: 返回结果的数据类型,若不指定,则默认与a一致n
out: 数据类型为数组。用来放置结果的替代输出数组,它必须具有与输出结果具有相同的形状和缓冲长度
返回
沿着指定轴的元素累加和所组成的数组,其形状应与输入数组a一致
1、对于一维数组而言
import numpy as np

arr=np.array([1,2,3,4,5,6,7,8,9])
result=arr.cumsum()    #此时axis只能取0,因此,axis=0可不写

#result: array([ 1,  3,  6, 10, 15, 21, 28, 36, 45], dtype=int32)
2、对于二维数组而言
import numpy as np

arr=np.array([[1,2,3],[4,5,6],[7,8,9]])

#沿着axis=0轴计算

result1=arr.cumsum(0)   #array([[ 1,  2,  3],[ 5,  7,  9],[12, 15, 18]], dtype=int32)

#沿着axis=1轴计算

result2=arr.cumsum(1)   #array([[ 1,  3,  6],[ 4,  9, 15],[ 7, 15, 24]], dtype=int32)

#arr.cumsum()并不是arr.cumsum(0)和arr.cumsum(1)的并集,而是将arr重塑为一维数组后的,再计算cumsum()的结果

arr.cumsum()#array([ 1,  3,  6, 10, 15, 21, 28, 36, 45], dtype=int32)
二、np.interp()
np.interp()是一个一维线性插值函数。
np.interp(x, xp, fp, left=None, right=None, period=None)
参数
x: 数组 待插入数据的横坐标
xp: 一维浮点数序列 原始数据点的横坐标,如果period参数没有指定那么就必须是递增的 否则,在使用xp = xp % period正则化之后,xp在内部进行排序
fp: 维浮点数或复数序列 原始数据点的纵坐标,和xp序列等长.
left: 可选参数,类型为浮点数或复数(对应于fp值) 当x < xp[0]时的插值返回值,默认为fp[0].
right: 可选参数,类型为浮点数或复数(对应于fp值),当x > xp[-1]时的插值返回值,默认为fp[-1].
period: None或者浮点数,可选参数 横坐标的周期 此参数使得可以正确插入angular x-coordinates. 如果该参数被设定,那么忽略left参数和right参数
返回
浮点数或复数(对应于fp值)或ndarray. 插入数据的纵坐标,和x形状相同
注意
在没有设置period参数时,默认要求xp参数是递增序列
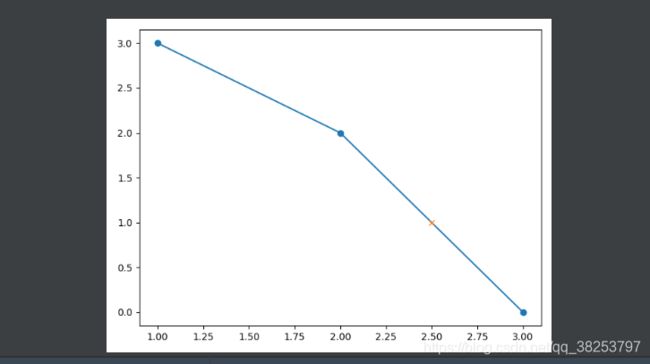
实例1、插入一个值
import numpy as np
import matplotlib.pyplot as plt

x = 2.5
xp = [1, 2, 3]
fp = [3, 2, 0]
y = np.interp(x, xp, fp)  # 1.0
plt.plot(xp, fp, '-o')
plt.plot(x, y, 'x')
plt.show()
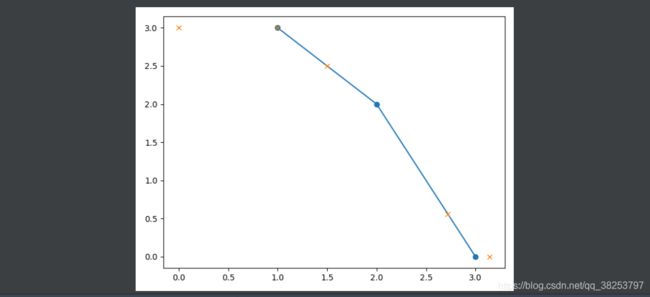
实例二、插入一个序列
import numpy as np
import matplotlib.pyplot as plt

x = [0, 1, 1.5, 2.72, 3.14]
xp = [1, 2, 3]
fp = [3, 2, 0]
y = np.interp(x, xp, fp)  # array([ 3. ,  3. ,  2.5 ,  0.56,  0. ])
plt.plot(xp, fp, '-o')
plt.plot(x, y, 'x')
plt.show()
三、np.maximum.accumulate
计算数组(或数组的特定轴)的累积最大值
例子
import numpy as np

d = np.array([2, 0, 3, -4, -2, 7, 9])
c = np.maximum.accumulate(d)
print(c)   # array([2, 2, 3, 3, 3, 7, 9])
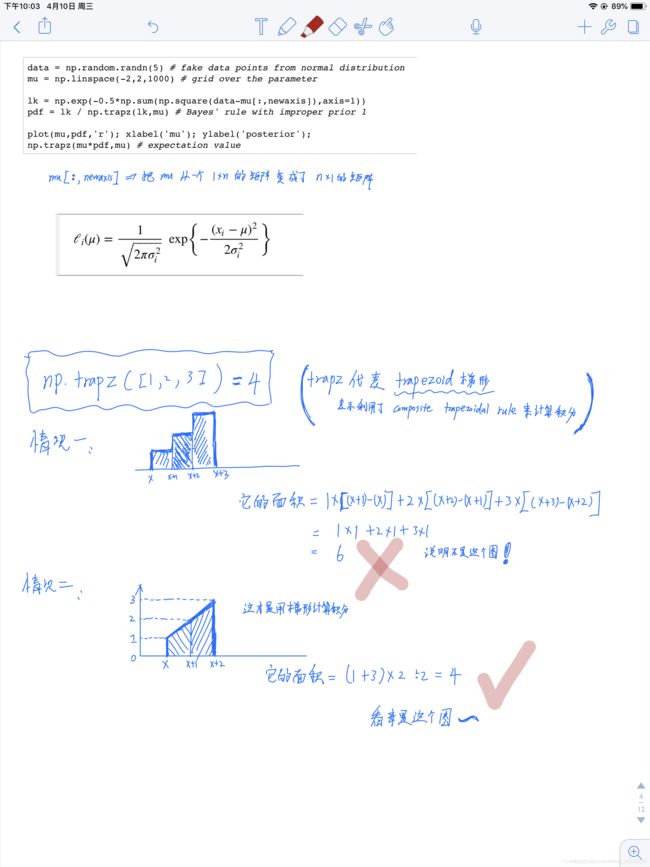
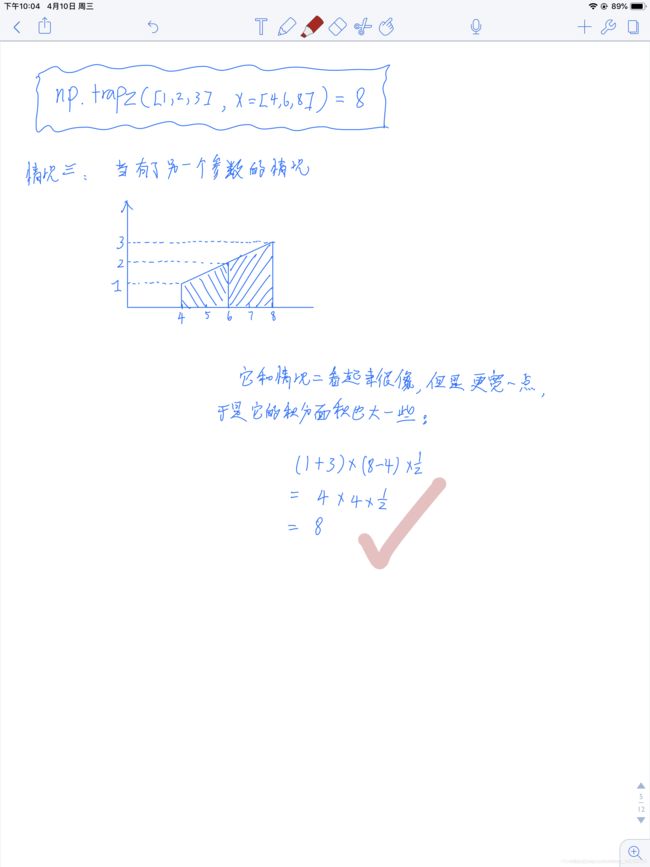
四、np.trapz
numpy.trapz(y, x=None, dx=1.0, axis=-1)


