第十七章 调试及安全性(In .net4.5) 之 程序诊断
1. 概述
生产环境中的程序,也是不能保证没有问题的。为了能方便的找出问题,.net提供了一些特性来进行程序诊断。
这些特性包括:logging、tracing 、程序性能分析(profiling) 和 性能计数器(performance counters).
2. 主要内容
2.1 Tracing 和 Logging
Tracing 是 一种监控程序执行的操作。可以用于显示程序运行过程中各个细节。
Logging 主要用于错误报告。可以配置Logging集中收集信息,通过e-mail发送或者直接记录到文件或数据库中。
.net提供了一些相关的类(System.Diagnostics下):
① Debug:只能用于Debug编译模式下,可用于显示基本的日志信息和执行判定。
Debug.WriteLine(“Starting application”); Debug.Indent(); int i = 1 + 2; Debug.Assert(i == 3); Debug.WriteLineIf(i > 0, “i is greater than 0”);
② TraceSource
TraceSource traceSource = new TraceSource(“myTraceSource”, SourceLevels.All); traceSource.TraceInformation(“Tracing application..”); traceSource.TraceEvent(TraceEventType.Critical, 0, “Critical trace”); traceSource.TraceData(TraceEventType.Information, 1, new object[] { “a”, “b”, “c” }); traceSource.Flush(); traceSource.Close(); // Outputs: // myTraceSource Information: 0 : Tracing application.. // myTraceSource Critical: 0 : Critical trace // myTraceSource Information: 1 : a, b, c
上述都是输出信息到输出窗口,生产环境中是看不到的。.net还提供了几种TraceListener,可以实现输出信息到各个介质。
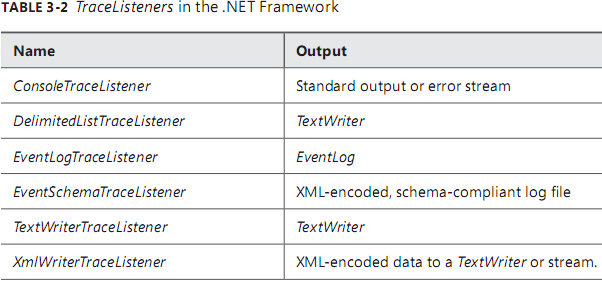
Stream outputFile = File.Create(“tracefile.txt”); TextWriterTraceListener textListener = new TextWriterTraceListener(outputFile); TraceSource traceSource = new TraceSource(“myTraceSource”, SourceLevels.All); traceSource.Listeners.Clear(); traceSource.Listeners.Add(textListener); traceSource.TraceInformation(“Trace output”); traceSource.Flush(); traceSource.Close();
还可以使用配置文件来配置跟踪信息
<?xml version=”1.0” encoding=”utf-8” ?>

<configuration>   <system.diagnostics>     <sources>       <source name=”myTraceSource” switchName=”defaultSwitch”>         <listeners>           <add initializeData=”output.txt”  type=”System.Diagnostics.TextWriterTraceListeer”             name=”myLocalListener”>

               <filter type=”System.Diagnostics.EventTypeFilter” initializeData=”Warning”/>

          </add>           <add name=”consoleListener” />

          <remove name=”Default”/>         </listeners>       </source>     </sources>     <sharedListeners>       <add initializeData=”output.xml” type=”System.Diagnostics.XmlWriterTraceListener”          name=”xmlListener” traceOutputOptions=”None” />       <add type=”System.Diagnostics.ConsoleTraceListener” name=”consoleListener”           traceOutputOptions=”None” />     </sharedListeners>  <switches>       <add name=”defaultSwitch” value=”All” />     </switches>   </system.diagnostics>

</configuration>
使用EventLog可以写入日志到系统日志中。还可以从系统日志获取日志或者订阅日志变更事件。
class EventLogSample { public static void Main() { EventLog applicationLog = new EventLog(“Application”, “.”, “testEventLogEvent”); applicationLog.EntryWritten += (sender, e) => { Console.WriteLine(e.Entry.Message); }; applicationLog.EnableRaisingEvents = true; applicationLog.WriteEntry(“Test message”, EventLogEntryType.Information); Console.ReadKey(); } }
2.2 程序性能分析(Profiling)
Profiling 是权衡程序对特定资源的占用情况的过程。
① 可以使用StopWatch类来监测指定代码的执行时间。
class Program { const int numberOfIterations = 100000; static void Main(string[] args) { Stopwatch sw = new Stopwatch(); sw.Start(); Algorithm1(); sw.Stop(); Console.WriteLine(sw.Elapsed); sw.Reset(); sw.Start(); Algorithm2(); sw.Stop(); Console.WriteLine(sw.Elapsed); Console.WriteLine(“Ready…”); Console.ReadLine(); } private static void Algorithm2() { string result = “”; for (int x = 0; x < numberOfIterations; x++) { result += ‘a’; } } private static void Algorithm1() { StringBuilder sb = new StringBuilder(); for (int x = 0; x < numberOfIterations; x++) { sb.Append(‘a’); } string result = sb.ToString(); } }
② Visual Studio 2012 包含了一个性能分析工具,可以以四种模式来分析程序性能:
CPU sampling :最轻量级选项。对程序只有轻微影响,主要用于对程序问题做初级的查找定位工作。
Instrumentation :该选项会植入一些代码到编译文件中,可以监测各个方法的执行。
.NET memory allocation :使用该选项,程序给新对象分配内存或者旧对象被垃圾回收时,都会中断程序。用于监测内存的使用情况。
Resource contention data:该选项用于多线程环境,用于查找指定方法访问指定资源前必须等待其他方法返回的原因。
2.3 创建和监测性能计数器
windows提供了性能监测器(Perfmon.exe),用于监测性能计数器。
通过PerformanceCounter类,可以使用代码读取性能计数器信息。
class Program { static void Main(string[] args) { Console.WriteLine(“Press escape key to stop”); using (PerformanceCounter pc = new PerformanceCounter(“Memory”, “Available Bytes”)) { string text = “Available memory: “; Console.Write(text); do { while (!Console.KeyAvailable) { Console.Write(pc.RawValue); Console.SetCursorPosition(text.Length, Console.CursorTop); } } while (Console.ReadKey(true).Key != ConsoleKey.Escape); } } }
性能计数器(Performance counters)的几种有用的类型:
① NumberOfItems32/NumberOfItems64:用于统计操作或者数据项的数量。
② RateOfCountsPerSecond32/RateOfCountsPerSecond64:用于计算操作或数据项每秒的数量。
③ AvergateTimer32: 计算完成一个过程或操作一个数据项的平均时间。
还可以创建和使用自定义的性能计数器(Performance counters)
class Program { static void Main(string[] args) { if (CreatePerformanceCounters()) { Console.WriteLine(“Created performance counters”); Console.WriteLine(“Please restart application”); Console.ReadKey(); return; } var totalOperationsCounter = new PerformanceCounter( “MyCategory”, “# operations executed”, “”, false); var operationsPerSecondCounter = new PerformanceCounter( “MyCategory”, “# operations / sec”, “”, false); totalOperationsCounter.Increment(); operationsPerSecondCounter.Increment(); } private static bool CreatePerformanceCounters() { if (!PerformanceCounterCategory.Exists(“MyCategory”)) { CounterCreationDataCollection counters = new CounterCreationDataCollection { new CounterCreationData( “# operations executed”, “Total number of operations executed”, PerformanceCounterType.NumberOfItems32), new CounterCreationData( “# operations / sec”, “Number of operations executed per second”, PerformanceCounterType.RateOfCountsPerSecond32) }; PerformanceCounterCategory.Create(“MyCategory”, “Sample category for Codeproject”, counters); return true; } return false; } }
3. 总结
① Logging 和 Tracing 是在生产环境监控程序的重要手段,应该从项目的开始阶段就考虑实现。
② 可以使用Debug和TraceSource类去记录和跟踪程序信息。还可以通过配置不同的监听器,来实现将跟踪到的信息发送到各个位置。
③ 通过程序性能监测工具,可以定位程序中的问题位置,从而更好的解决问题。