Python3《机器学习实战》学习笔记(五):Logistic回归基础篇之梯度上升算法
文章目录
- 一、简介
- 二、Logistic回归
- 三、代码实战
-
- 3.1 加载数据
- 3.2 函数
- 3.3梯度上升算法
- 3.4绘制数据集
- 3.5主函数
- 四、总结
一、简介
通过Logistic回归和梯度上升两方法开始,首先从原理开始推论。
二、Logistic回归
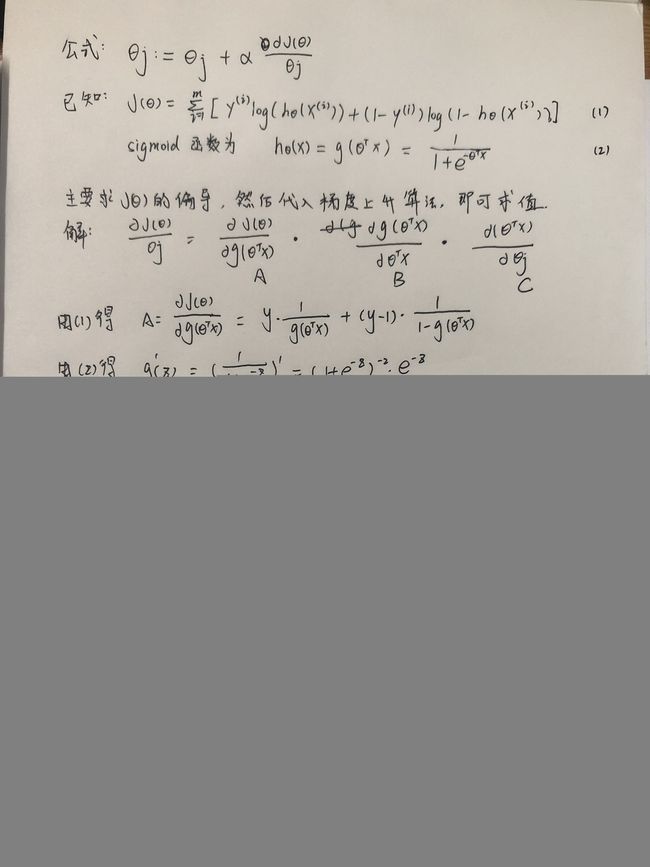
链接: 可以参照之前写过的文章(吴恩达机器学习课里面的)
因为里面公式推导都是类似的,因此可以直接拿来用
这个例子主要是主要用来模拟迭代的方式。就像爬坡一样,一点点的逼近极值
'''
主要用来模拟迭代的方式。就像爬坡一样,一点点的逼近极值
函数说明:梯度上升算法测试函数
求函数f(x) = -x^2 + 4x的极大值
@Project :MachineLearning
@File    :Gradient.py
@Author  :Kyrie Irving
@Date    :2022/10/27 16:29
'''

def Gradient_Ascent_test():
    # 这个给出的是原函数f(x)求导的结果
    def f_prime(x_old):
        return -2 * x_old + 4
    x_old = -1
    x_new = 0
    alpha = 0.01
    presision = 0.00000001                                #精度,也就是更新阈值

    while abs(x_old - x_new) > presision:
        x_old = x_new
        x_new = x_old + alpha * f_prime(x_old)

    print(x_new)


if __name__ == '__main__':
    Gradient_Ascent_test()


1.999999515279857

Process finished with exit code 0
三、代码实战
3.1 加载数据
'''
函数说明:加载数据
'''
def loadDataSet():
    dataMat = []    # 创建数据列表
    labelMat = []   # 创建标签列表
    fr = open('testSet.txt')
    for line in fr.readlines():
        lineArr = line.strip().split()
        dataMat.append([1.0, float(lineArr[0]), float(lineArr[1])])
        labelMat.append(float(lineArr[2]))
    fr.close()

    return dataMat, labelMat
3.2 函数
def sigmoid(inX):
    return 1.0 / (1 + np.exp(-inX))
3.3梯度上升算法
'''
函数说明:梯度上升算法
'''
def gradAscent(dataMatIn, classLabels):
    dataMatrix = np.mat(dataMatIn)
    labelMat = np.mat(classLabels).transpose()
    m, n = np.shape(dataMatrix)  # 返回dataMatrix的大小。m为行数,n为列数。
    alpha = 0.001   #移动步长,也就是学习速率,控制更新的幅度。
    maxCycles = 500  # 最大迭代次数

    # 这里的weights 可以理解成theta 一直在变化
    weights = np.ones((n, 1))
    print(weights)
    for k in range(maxCycles):
        h = sigmoid(dataMatrix * weights)
        # labelMat相当于y  y不一定是纵坐标 这里是两种类型分类的目的
        error = labelMat - h
        weights = weights + alpha * dataMatrix.transpose() * error

    print('weights', weights)
    return weights.getA()
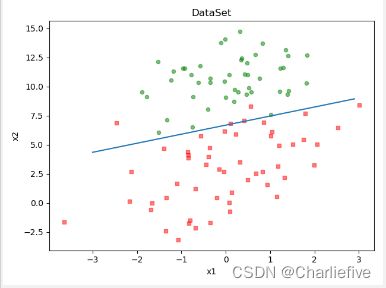
3.4绘制数据集
'''
函数说明:绘制数据集
'''
def plotDataSet(weights):
    dataMat, labelMat = loadDataSet()
    dataArr = np.array(dataMat) # 转换成numpy的array数组
    m = np.shape(dataMat)[0]    # 数据个数
    xcord1 = []
    ycord1 = []  # 正样本
    xcord2 = []
    ycord2 = []  # 负样本

    for i in range(m):
        if int(labelMat[i]) == 1:
            xcord1.append(dataArr[i, 1])
            ycord1.append(dataArr[i, 2])
        else:
            xcord2.append(dataArr[i, 1])
            ycord2.append(dataArr[i, 2])


    # 画图
    print(xcord1, ycord1, xcord2, ycord2)
    fig = plt.figure()
    ax = fig.add_subplot(111)  # 添加subplot 该图所在位置 第一行第一列第一个
    ax.scatter(xcord1, ycord1, s=20, c='red', marker='s', alpha=.5)  # 绘制正样本
    ax.scatter(xcord2, ycord2, s=20, c='green', alpha=.5)  # 绘制负样本

    # 画线
    x = np.arange(-3.0, 3.0, 0.1)
    y = (-weights[0] - weights[1] * x) / weights[2] # 这部分可以公式推导 假设weights = [a0, a1, a2] 那么a0 + a1*x + a2*y = 0
    ax.plot(x, y)
    plt.title('DataSet')  # 绘制title
    plt.xlabel('x1')
    plt.ylabel('x2')  # 绘制label
    plt.show()  # 显示
3.5主函数
if __name__ == '__main__':
    dataMat, labelMat = loadDataSet()
    weights = gradAscent(dataMat, labelMat)

    plotDataSet(weights)
四、总结
收集数据:采用任意方法收集数据。
准备数据:由于需要进行距离计算,因此要求数据类型为数值型。另外,结构化数据格式则最佳。
分析数据:采用任意方法对数据进行分析。
训练算法:大部分时间将用于训练,训练的目的是为了找到最佳的分类回归系数。
测试算法:一旦训练步骤完成,分类将会很快。
使用算法:首先,我们需要输入一些数据,并将其转换成对应的结构化数值;接着,基于训练好的回归系数,就可以对这些数值进行简单的回归计算,判定它们属于哪个类别;在这之后,我们就可以在输出的类别上做一些其他分析工作。
其他:
Logistic回归的目的是寻找一个非线性函数Sigmoid的最佳拟合参数,求解过程可以由最优化算法完成。
本文讲述了Logistic回归原理以及数学推导过程。

