Matlab实现数字图像处理——滤波
Matlab实现数字图像处理——滤波
-
- 同态滤波
- 局部直方图均衡
- 傅立叶变换
- 自适应直方图均衡
- 巴特沃斯滤波器
- 均值滤波
- 高斯滤波器
- 半邻域滤波
- 中值滤波
- 多窗口中值滤波
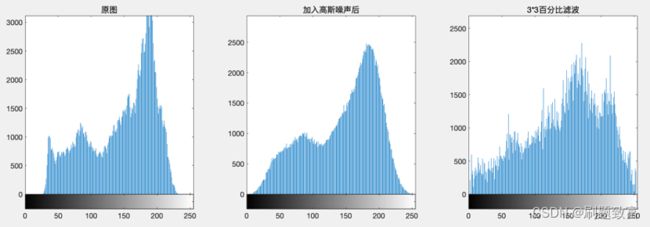
- 百分比滤波
- 锐化
- 拉普拉斯边界检测与增强
- 噪声对拉普拉斯边界检测的影响
本文介绍了使用matlab代码实现数字图像处理中各种滤波方法。
同态滤波
I = imread('FeiWang.jpg');
G = rgb2gray(I);
figure();
imshow(G), title('OriginalFigure');
homo_flt(G);
function I3 = homo_flt(I)
I=double(I);
[M,N]=size(I);
rL=0.5;
rH=4.7;
c=2;
d0=10;
I1=log(I+1);
FI=fft2(I1);
n1=floor(M/2);
n2=floor(N/2);
for i=1:M
    for j=1:N
        D(i,j)=((i-n1).^2+(j-n2).^2);
        H(i,j)=(rH-rL).*(exp(c*(-D(i,j)./(d0^2))))+rL;
    end
end
I2=ifft2(H.*FI);
I3=real(exp(I2));
figure();
imshow(I3,[]),title('HomoFltFigure');
end
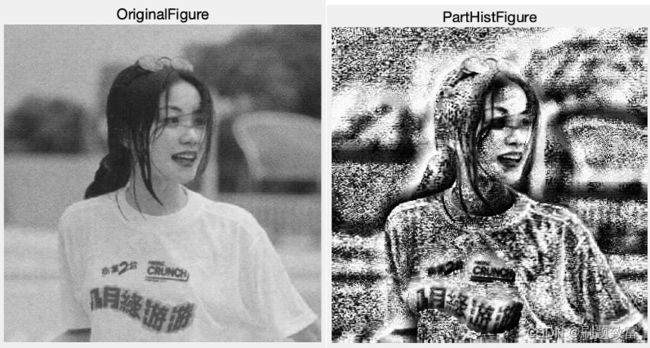
局部直方图均衡
I = imread('FeiWang.jpg');
G = rgb2gray(I);
figure();
imshow(G), title('OriginalFigure');

image = G;
n=25;
model(1:n,1:n)=1;
imgTend=wextend('2D','sym',image,n);
TendTrans=double(imgTend);
[row,col]=size(imgTend);
TendTransTmp=TendTrans;
for i=n+1:row-n
 for j=n+1:col-n
    ModelResult=TendTrans(i:i+(n-1),j:j+(n-1)).*model(1:n,1:n);
    ModelEpual=hist_1(uint8(ModelResult));
    equalTmp=double(ModelEpual);
    TendTransTmp(i,j)=equalTmp(3,3);
 end
end
outcome=TendTransTmp(n+1:row-n,n+1:col-n);
outcome=uint8(outcome);
figure();
imshow(outcome),title('PartHistFigure');

function hist_img = hist_1(I)
    [M, N] = size(I);
    size_img = M*N;
    c = zeros(1,256);
    b= c;
    temp = I(:);
    temp = sort(temp);
    for i = 1:size_img
        c(temp(i)+1) = c(temp(i)+1)+1;
    end
    a = c;
    for i = 2:256
       a(i) = c(i) + a(i-1);
    end
    min_cdf = 10000;
    for i = 1:256
       if a(i)>0
           if a(i) < min_cdf
                min_cdf = a(i);
           end
       end
    end
    for j = 1:256
        if a(j) > 0
             b(j) = round(255*(a(j)-min_cdf)/(size_img-min_cdf));
        end
    end
    for i = 1:M
        for j = 1:N
            I(i,j) = b(I(i,j)+1);
        end
    end
    hist_img = I;
end
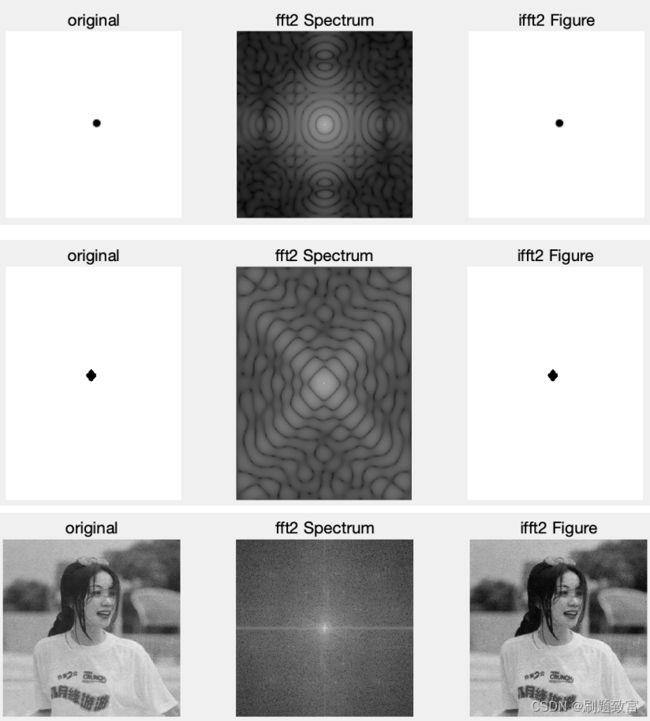
傅立叶变换
dot = imread('dot.png');
rhombus = imread('rhombus.png');
original = imread('FeiWang.jpg');

fc_fft_ifft(dot);
fc_fft_ifft(rhombus);
fc_fft_ifft(original);

function fc_fft_ifft(I)
I = rgb2gray(I);
I1=fft2(I);
I2=uint8(real(ifft2(I1)));
I1=log(1+abs(fftshift(I1)));

figure;
subplot(1,3,1);
imshow(I);
title('original');
subplot(1,3,2);
imshow(I1,[]);
title('fft2 Spectrum');
subplot(1,3,3);
imshow(I2,[]);
title('ifft2 Figure');
end
自适应直方图均衡
f = imread('FeiWang.jpg');
f = rgb2gray(f);
figure;
imshow(f);

g1 = adapthisteq(f);
figure;
imshow(g1),title('AdaptHistFigure');

g2 = adapthisteq(f, 'NumTiles', [100 100]);
figure;
imshow(g2),title('AdaptHistFigure NumTiles[100 100]');

g3 = adapthisteq(f, 'NumTiles', [25 25], 'ClipLimit', 0.05);
figure;
imshow(g3),title('AdaptHist NumTiles[25 25] ClipLimit=0.05');
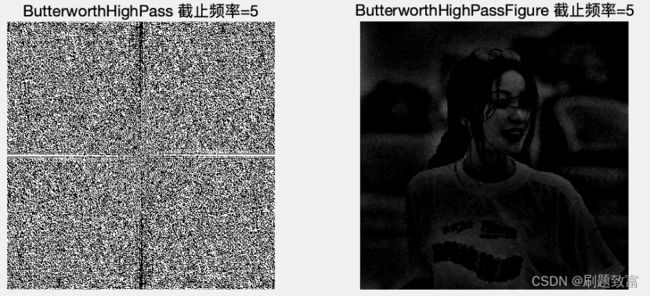
巴特沃斯滤波器
I=imread('FeiWang.jpg');
I = rgb2gray(I);
figure();
imshow(I),title('original');

ButterworthFilter(I,2,0.5,100);


function ButterworthFilter(I,nn,w,d0)
f=double(I);
g=fft2(f);
g=fftshift(g);

[M,N,~]=size(g);
m=floor(M/2);n=floor(N/2);

for i=1:M
    for j=1:N
    d=sqrt((i-m)^2+(j-n)^2);
    h=1/(1+w*(d/d0)^(2*nn));
    result(i,j)=h*g(i,j);
end
end
figure();
subplot(1,2,1);
imshow(log(1+abs(result))),title('ButterworthLowPass');

result=ifftshift(result);
J2=ifft2(result);
J3=uint8(real(J2));
subplot(1,2,2);
imshow(J3),title('ButterworthLowPassFigure');

for i=1:M
    for j=1:N
    d=sqrt((i-m)^2+(j-n)^2);
    h=1/(1+w*(d0/d)^(2*nn));
    result(i,j)=h*g(i,j);
    end
end

figure();
subplot(1,2,1);
imshow(result),title('ButterworthHighPass');

result=ifftshift(result);
J2=ifft2(result);
J3=uint8(real(J2));
subplot(1,2,2);imshow(J3);
title('ButterworthHighPassFigure');

for i=1:M
    for j=1:N
    d=sqrt((i-m)^2+(j-n)^2);
    h=1/(1-(d*w/(d^2-d0^2))^(2*nn));
    result(i,j)=h*g(i,j);
    end
end

figure();
subplot(1,2,1);
imshow(result),title('ButterworthBendPass');

result=ifftshift(result);
J2=ifft2(result);
J3=uint8(real(J2));
subplot(1,2,2);
imshow(J3),title('ButterworthBandPassFigure');
end
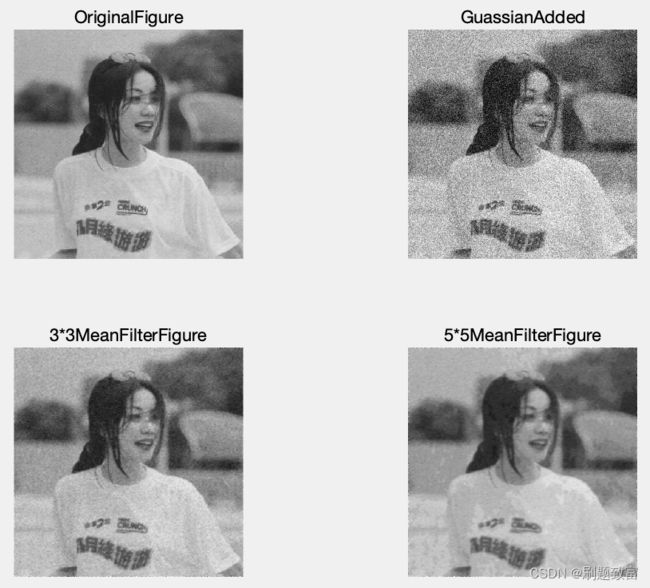
均值滤波
f=imread('FeiWang.jpg');
[m,n,z]=size(f);
f1=imnoise(f,'gaussian',0,0.02);
f1= rgb2gray(f1);
f= rgb2gray(f);
figure();
subplot(2,2,1),imshow(f),title('OriginalFigure')
subplot(2,2,2),imshow(f1),title('GuassianAdded')
f2=f1;
for i=1:m-2
for j=1:n-2
f2(i+1,j+1,:)=round(f2(i,j,:)/9+f2(i,j+1,:)/9+f2(i,j+2,:)/9+f2(i+1,j,:)/9+f2(i+1,j+1,:)/9+f2(i+1,j+2,:)/9+f2(i+2,j,:)/9+f2(i+2,j+1,:)/9+f2(i+2,j+2,:)/9);
end
end
subplot(2,2,3),imshow(f2),title('3*3MeanFilterFigure');
f3=f1;
for i=1:m-4
for j=1:n-4
f3(i+2,j+2,:)=round(f3(i,j,:)/25+f3(i,j+1,:)/25+f3(i,j+2,:)/25+f3(i,j+3,:)/25+f3(i,j+4,:)/25+f3(i+1,j,:)/25+f3(i+1,j+1,:)/25+f3(i+1,j+2,:)/25+f3(i+1,j+3,:)/25+f3(i+1,j+4,:)/25+f3(i+2,j,:)/25+f3(i+2,j+1,:)/25+...
f3(i+2,j+2,:)/25+f3(i+2,j+3,:)/25+f3(i+2,j+4,:)/25+f3(i+3,j,:)/25+f3(i+3,j+1,:)/25+f3(i+3,j+2,:)/25+f3(i+3,j+3,:)/25+f3(i+3,j+4,:)/25+...
f3(i+4,j,:)/25+f3(i+4,j+1,:)/25+f3(i+4,j+2,:)/25+f3(i+4,j+3,:)/25+f3(i+4,j+4,:)/25);
end
end
subplot(2,2,4),imshow(f3),title('5*5MeanFilterFigure');
figure(),
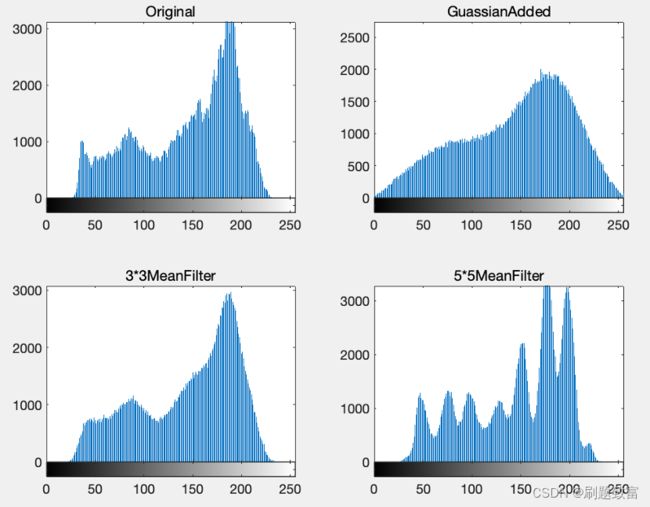
subplot(2,2,1),imhist(f),title('Original');
subplot(2,2,2),imhist(f1),title('GuassianAdded');
subplot(2,2,3),imhist(f2),title('3*3MeanFilter');
subplot(2,2,4),imhist(f3),title('5*5MeanFilter');
高斯滤波器
f=imread('FeiWang.jpg');
[m,n,z]=size(f);
f1=imnoise(f,'gaussian',0,0.02);
f= rgb2gray(f);
f1= rgb2gray(f1);
figure();
subplot(2,2,1),imshow(f),title('OriginalFigure');
subplot(2,2,2),imshow(f1),title('GuassianAdded')
f2=f1;
for i=1:m-2
for j=1:n-2
f2(i+1,j+1,:)=round(2*f2(i,j,:)/10+f2(i,j+1,:)/10+f2(i,j+2,:)/10+f2(i+1,j,:)/10+f2(i+1,j+1,:)/10+f2(i+1,j+2,:)/10+f2(i+2,j,:)/10+f2(i+2,j+1,:)/10+f2(i+2,j+2,:)/10);end
end
subplot(2,2,3),imshow(f2),title('3*3GuassianFilter');
t3=f1;
for i=1:m-4
for j=1:n-4
t3(i+2,j+2,:)=round(t3(i,j+2,:)/24+2*t3(i+1,j+1,:)/24+2*t3(i+1,j+2,:)/24+2*t3(i+1,j+3,:)/24+t3(i+2,j,:)/24+2*t3(i+2,j+1,:)/24+...
4*t3(i+2,j+2,:)/24+2*t3(i+2,j+3,:)/24+t3(i+2,j+4,:)/24+2*t3(i+3,j+1,:)/24+2*t3(i+3,j+2,:)/24+2*t3(i+3,j+3,:)/24+...
t3(i+4,j+2,:)/24);
end
end
subplot(2,2,4),imshow(t3),title('5*5GussianFilter');
figure(),
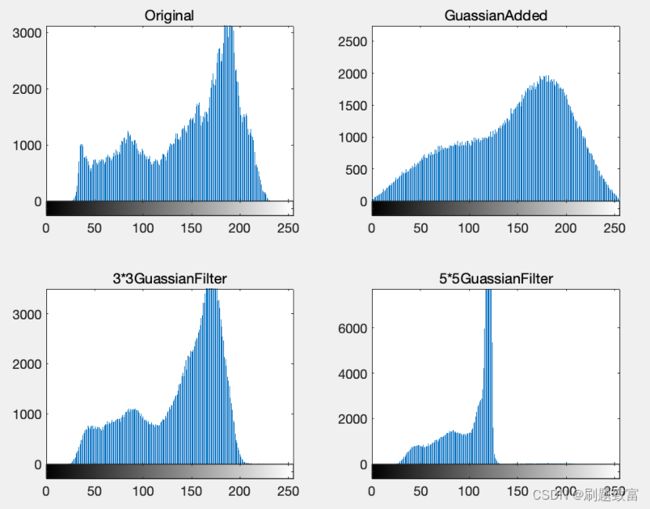
subplot(2,2,1),imhist(f),title('Original');
subplot(2,2,2),imhist(f1),title('GuassianAdded');
subplot(2,2,3),imhist(f2),title('3*3GuassianFilter');
subplot(2,2,4),imhist(t3),title('5*5GuassianFilter');
半邻域滤波
f=imread('FeiWang.jpg');
[m,n,z]=size(f);
f1=imnoise(f,'gaussian',0,0.005);
f1= rgb2gray(f1);
f= rgb2gray(f);
figure();
subplot(1,3,1),imshow(f),title('OriginalFigure')
subplot(1,3,2),imshow(f1),title('GuassianAddedd')
f2=f1;
for i=1:m-2
for j=1:n-2
temp=[f2(i,j,:),f2(i,j+1,:),f2(i,j+2,:),f2(i+1,j,:),f2(i+1,j+2,:),f2(i+2,j,:),f2(i+2,j+1,:),f2(i+2,j+2,:)];
temp=sort(temp);
temp1=round((temp(1)+temp(2)+temp(3))/3);
temp2=round((temp(4)+temp(5)+temp(6)+temp(7)+temp(8))/5);
n=round((3*temp1+5*temp2)/9);
if(abs(temp1-temp2)>3)
f2(i+1,j+1,:)=temp2;
else
f2(i+1,j+1,:)=n;
end
end
end
subplot(1,3,3),imshow(f2),title('3*3半邻域滤波');
figure(),
subplot(1,3,1),imhist(f),title('Original');
subplot(1,3,2),imhist(f1),title('GuassianAdded');
subplot(1,3,3),imhist(f2),title('3*3半邻域滤波');
中值滤波
f=imread('FeiWang.jpg');
[m,n,z]=size(f);
f1=imnoise(f,'gaussian',0,0.02);
f= rgb2gray(f);
f1= rgb2gray(f1);
figure(1);
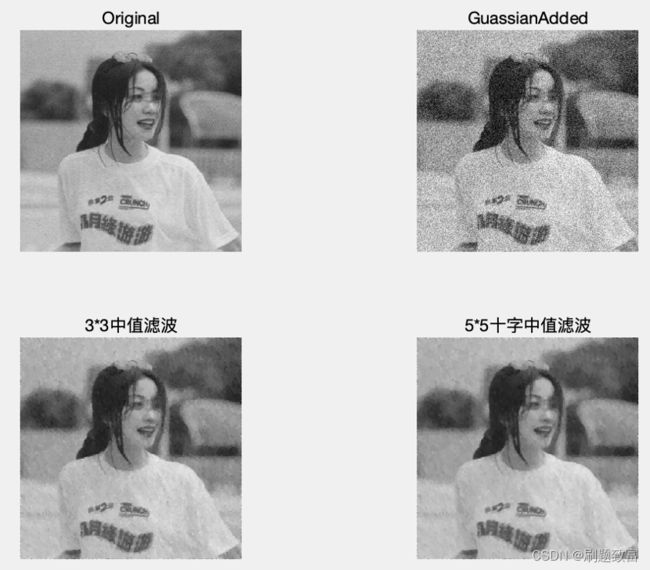
subplot(2,2,1),imshow(f),title('Original');
subplot(2,2,2),imshow(f1),title('GuassianAdded')
f2=f1;
for i=1:m-2
for j=1:n-2
temp=[f2(i,j,:),f2(i,j+1,:),f2(i,j+2,:),f2(i+1,j,:),f2(i+1,j+2,:),f2(i+2,j,:),f2(i+2,j+1,:),f2(i+2,j+2,:),f2(i+1,j+1,:)];
temp=sort(temp);
f2(i+1,j+1,:)=temp(5);
end
end
subplot(2,2,3),imshow(f2),title('3*3中值滤波');
t3=f1;
for i=1:m-4
for j=1:n-4
temp=[f2(i,j+2,:),f2(i+1,j+2,:),f2(i+2,j,:),f2(i+2,j+1,:),f2(i+2,j+2,:),f2(i+2,j+3,:),f2(i+2,j+4,:),f2(i+3,j+2,:),f2(i+4,j+2,:)];
temp=sort(temp);
t3(i+2,j+2,:)=temp(5);
end
end
subplot(2,2,4),imshow(t3),title('5*5十字中值滤波');
figure(2),
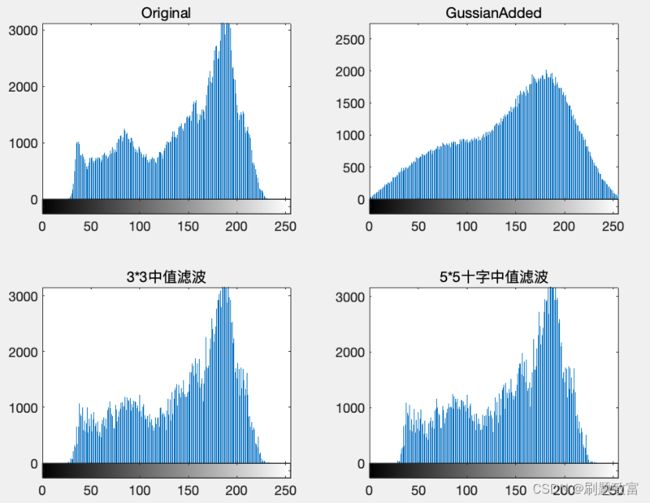
subplot(2,2,1),imhist(f),title('Original');
subplot(2,2,2),imhist(f1),title('GussianAdded');
subplot(2,2,3),imhist(f2),title('3*3中值滤波');
subplot(2,2,4),imhist(t3),title('5*5十字中值滤波');
多窗口中值滤波
t=imread('FeiWang.jpg');
[m,n,z]=size(t);
t1=imnoise(t,'gaussian',0,0.01);
t1= rgb2gray(t1);
t= rgb2gray(t);
figure();
subplot(1,3,1),imshow(t),title('原图')
subplot(1,3,2),imshow(t1),title('3*3多窗口')
t2=t1;
for i=1:m-2
for j=1:n-2
temp=[t2(i,j,:),t2(i,j+1,:),t2(i,j+2,:),t2(i+1,j,:),t2(i+1,j+2,:),t2(i+2,j,:),t2(i+2,j+1,:),t2(i+2,j+2,:),t2(i+1,j+1)];
temp1=[temp(2),temp(4),temp(5),temp(9),temp(7)];
temp2=[temp(1),temp(3),temp(6),temp(8),temp(9)];
temp1=sort(temp1);
temp2=sort(temp2);
ave=round((sum(temp))/9);
midten=temp1(3);
midx=temp2(3);
delta1=midten-t2(i+1,j+1,:);
delta2=midx-t2(i+1,j+1,:);
delta3=t2(i+1,j+1,:)-ave;
if(delta1==delta2)
t2(i+1,j+1,:)=midten;
else if(delta1~=delta2 && delta3>=0)
t2(i+1,j+1,:)=max(midten,midx);
else if(delta1~=delta2 && delta3<0)
t2(i+1,j+1,:)=min(midten,midx);
end
end
end
end
end
subplot(1,3,3),imshow(t2),title('3*3');
figure(),
subplot(1,3,1),imhist(t),title('原图');
subplot(1,3,2),imhist(t1),title('加入高斯');
subplot(1,3,3),imhist(t2),title('3*3多窗口');
百分比滤波
f=imread('FeiWang.jpg');
[m,n,z]=size(f);
f1=imnoise(f,'gaussian',0,0.005);
f1= rgb2gray(f1);%彩色图åƒè½¬ä¸ºç°åº¦å›¾åƒ
f= rgb2gray(f);
figure();
subplot(1,3,1),imshow(f),title('原图')
subplot(1,3,2),imshow(f1),title('加入高斯噪声')
f2=f1;
for i=1:m-2
for j=1:n-2
temp=[f2(i,j,:),f2(i,j+1,:),f2(i,j+2,:),f2(i+1,j,:),f2(i+1,j+2,:),f2(i+2,j,:),f2(i+2,j+1,:),f2(i+2,j+2,:),f2(i+1,j+1)];
temp=sort(temp);
max=temp(9);
min=temp(1);
if(max-f2(i+1,j+1,:)<=f2(i+1,j+1,:)-min)
f2(i+1,j+1,:)=max;
else
f2(i+1,j+1,:)=min;
end
end
end
subplot(1,3,3),imshow(f2),title('3*3百分比滤波');
figure(),
subplot(1,3,1),imhist(f),title('原图');
subplot(1,3,2),imhist(f1),title('加入高斯噪声');
subplot(1,3,3),imhist(f2),title('3*3百分比滤波');
锐化
f=imread('FeiWang.jpg');
[m,n,z]=size(f);
f= rgb2gray(f);
figure();
subplot(2,2,1),imshow(f),title('原图')
f2=f;
f3=f;
f4=f;
for i=1:m-2
for j=1:n-2
temp=[f2(i,j,:),f2(i,j+1,:),f2(i,j+2,:),f2(i+1,j,:),f2(i+1,j+1),f2(i+1,j+2,:),f2(i+2,j,:),f2(i+2,j+1,:),f2(i+2,j+2,:)];
f2(i+1,j+1)=5*temp(5)-temp(2)-temp(4)-temp(6)-temp(8);
end
end
for i=1:m-2
for j=1:n-2
temp1=[f3(i,j,:),f3(i,j+1,:),f3(i,j+2,:),f3(i+1,j,:),f3(i+1,j+1),f3(i+1,j+2,:),f3(i+2,j,:),f3(i+2,j+1,:),f3(i+2,j+2,:)];
f3(i+1,j+1)=round((9*temp1(5)-2*(temp1(2)+temp1(4)+temp1(6)+temp1(8))+temp1(1)+temp1(3)+temp1(7)+temp1(9))/5);
end
end
for i=1:m-2
for j=1:n-2
temp2=[f4(i,j,:),f4(i,j+1,:),f4(i,j+2,:),f4(i+1,j,:),f4(i+1,j+1),f4(i+1,j+2,:),f4(i+2,j,:),f4(i+2,j+1,:),f4(i+2,j+2,:)];
f4(i+1,j+1)=round((8*temp2(5)-1.25*(temp2(2)+temp2(4)+temp2(6)+temp2(8))-0.5*(temp2(1)+temp2(3)+temp2(7)+temp2(9))));
end
end
subplot(2,2,2),imshow(f2),title('锐化矩阵为[[0 -1 0],[-1 5 -1], [0 -1 0]]');
subplot(2,2,3),imshow(f3),title('锐化矩阵为[[0.2 -0.3 -.3],[-0.4 1.8 -0.4],[0.2 -0.4 0.2]]');
subplot(2,2,4),imshow(f4),title('锐化矩阵为[[-0.5 -1.25 -0.5],[-1.25 8 -1.25],[-0.5 -1.25 -0.5]]');
拉普拉斯边界检测与增强
f=imread('FeiWang.jpg');
[m,n,z]=size(f);
f= rgb2gray(f);
f1=f;
figure();
subplot(1,3,1),imshow(f),title('Original')
for i=1:m-2
for j=1:n-2
temp=[f1(i,j,:),f1(i,j+1,:),f1(i,j+2,:),f1(i+1,j,:),f1(i+1,j+1,:),f1(i+1,j+2,:),f1(i+2,j,:),f1(i+2,j+1,:),f1(i+2,j+2,:)];
f1(i+1,j+1,:)=4*temp(5)-temp(2)-temp(4)-temp(6)-temp(8);
end
end
t2=f+f1;
subplot(1,3,2),imshow(f1),title('LaplaceEdgeDetect');
subplot(1,3,3),imshow(t2),title('LaplaceEdgeStrengthen');
噪声对拉普拉斯边界检测的影响
f=imread('FeiWang.jpg');
[m,n,z]=size(f);
f1=imnoise(f,'gaussian',0,0.02);
f= rgb2gray(f);
f1= rgb2gray(f1);
figure();
subplot(1,5,1),imshow(f),title('原图');
subplot(1,5,2),imshow(f1),title('加入高斯噪声');
f2=f1;
for i=1:m-2
for j=1:n-2
temp=[f2(i,j,:),f2(i,j+1,:),f2(i,j+2,:),f2(i+1,j,:),f2(i+1,j+1,:),f2(i+1,j+2,:),f2(i+2,j,:),f2(i+2,j+1,:),f2(i+2,j+2,:)];
f2(i+1,j+1,:)=4*temp(5)-temp(2)-temp(4)-temp(6)-temp(8);
end
end
subplot(1,5,3),imshow(f2),title('拉普拉斯边界检测');
f3=f1;
for i=1:m-2
for j=1:n-2
f3(i+1,j+1,:)=round(2*f3(i,j,:)/10+f3(i,j+1,:)/10+f3(i,j+2,:)/10+f3(i+1,j,:)/10+f3(i+1,j+1,:)/10+f3(i+1,j+2,:)/10+f3(i+2,j,:)/10+f3(i+2,j+1,:)/10+f3(i+2,j+2,:)/10);end
end
subplot(1,5,4),imshow(f3),title('高斯滤波');
f4=f3;
for i=1:m-2
for j=1:n-2
temp=[f4(i,j,:),f4(i,j+1,:),f4(i,j+2,:),f4(i+1,j,:),f4(i+1,j+1,:),f4(i+1,j+2,:),f4(i+2,j,:),f4(i+2,j+1,:),f4(i+2,j+2,:)];
f4(i+1,j+1,:)=4*temp(5)-temp(2)-temp(4)-temp(6)-temp(8);
end
end
subplot(1,5,5),imshow(f4),title('高斯滤波后的拉普拉斯边界检测');
figure(),
subplot(1,5,1),imhist(f),title('原图');
subplot(1,5,2),imhist(f1),title('加入高斯噪声后');
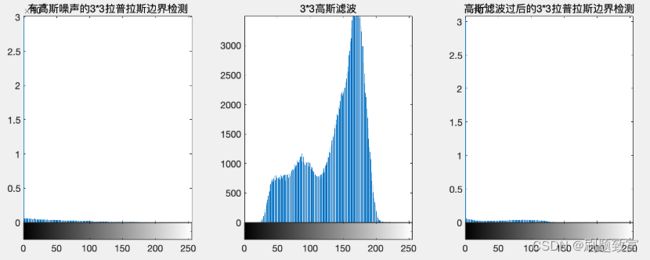
subplot(1,5,3),imhist(f2),title('有高斯噪声的拉普拉斯边界检测');
subplot(1,5,4),imhist(f3),title('3*3高斯滤波');
subplot(1,5,5),imhist(f4),title('高斯滤波过后的拉普拉斯边界检测');

