机器学习实战:Bank Marketing银行对客户订阅理财产品的预测
文章目录
- 概要
- 一、分析训练集整体情况
- 二、特征工程
- 1.创造特征
- 2.筛选特征
- 三、数据处理
- 四、模型预测
概要
该数据与一家葡萄牙银行机构的直接营销活动(电话)有关。分类目标是预测客户是否会订阅定期存款(变量 y)。
数据集介绍:营销活动基于电话。通常,需要与同一客户联系不止一位,才能了解产品(银行定期存款)是否会被(“是”)订阅(“否”),训练集特征如下:
- Age (numeric)
- Job : type of job (categorical: 'admin.', 'blue-collar', 'entrepreneur', 'housemaid', 'management', 'retired', 'self-employed', 'services', 'student', 'technician', 'unemployed', 'unknown')
- Marital : marital status (categorical: 'divorced', 'married', 'single', 'unknown' ; note: 'divorced' means divorced or widowed)
- Education (categorical: 'basic.4y', 'basic.6y', 'basic.9y', 'high.school', 'illiterate', 'professional.course', 'university.degree', 'unknown')
- Default: has credit in default? (categorical: 'no', 'yes', 'unknown')
- Housing: has housing loan? (categorical: 'no', 'yes', 'unknown')
- Loan: has personal loan? (categorical: 'no', 'yes', 'unknown')
提示:以下是本篇文章正文内容,下面案例可供参考
一、分析训练集整体情况
- 引入库并导入训练集
import numpy as np import pandas as pd import random import warnings warnings.filterwarnings("ignore") import seaborn as sns import matplotlib.pyplot as plt %matplotlib inline from sklearn.model_selection import GridSearchCV train_data_file = "bank-full.csv" df = pd.read_csv(train_data_file,sep=';') -
查看数据
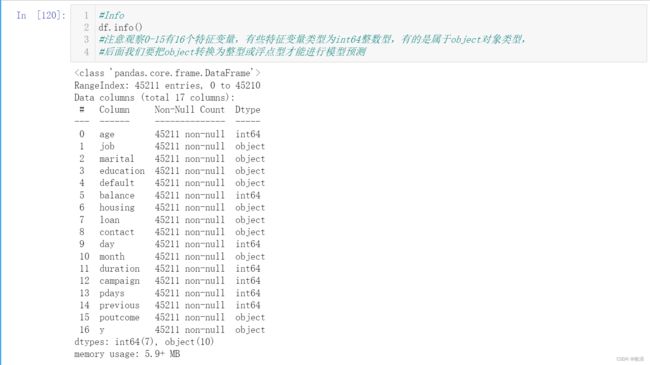
可以看到,四万多条数据里面标签结果为yes即为1的样本数量只有5289条!
对于二分类问题,0和1两种标签结果应该尽量保持一比一,此数据集并没有很好遵守这种分布,因此对后面模型训练有一定难度,但是也很好理解,毕竟现实中最终愿意买单的客户也是少数(^_^)
3.用条形图展示一下各特征变量
categorcial_variables = ['job', 'marital', 'education', 'default', 'loan', 'contact', 'month', 'poutcome','y']
for col in categorcial_variables:
    plt.figure(figsize=(10,4))
    sns.barplot(df[col].value_counts().values, df[col].value_counts().index)
    plt.title(col)
    plt.tight_layout()
4.每个类别的目标类的归一化相对频率列表
每个特征的每个类别的归一化分布以及正负频率之间的绘图差异。正值意味着该类别倾向于将订阅的客户,而负值则倾向于不购买产品。
categorcial_variables = ['job', 'marital', 'education', 'default', 'loan', 'contact', 'month',  'poutcome','y']
for col in categorcial_variables:
    plt.figure(figsize=(10,4))
    #Returns counts of unique values for each outcome for each feature.
    pos_counts = df.loc[df.y.values == 'yes', col].value_counts()
    neg_counts = df.loc[df.y.values == 'no', col].value_counts()

    all_counts = list(set(list(pos_counts.index) + list(neg_counts.index)))

    #Counts of how often each outcome was recorded.
    freq_pos = (df.y.values == 'yes').sum()
    freq_neg = (df.y.values == 'no').sum()

    pos_counts = pos_counts.to_dict()
    neg_counts = neg_counts.to_dict()

    all_index = list(all_counts)
    all_counts = [pos_counts.get(k, 0) / freq_pos - neg_counts.get(k, 0) / freq_neg for k in all_counts]

    sns.barplot(all_counts, all_index)
    plt.title(col)
    plt.tight_layout()
5.再次查看训练集
推断/:数据集中有许多变量的未知值。有很多方法可以处理丢失的数据。其中一种方法是丢弃该行,但这将导致数据集的减少,因此不符合我们构建准确而现实的预测模型的目的。
另一种方法是从其他变量中巧妙地推断未知变量的值。这是一种插补方法,我们使用其他自变量来推断缺失变量的值。这并不能保证所有缺失的值都会得到解决,但其中大多数都会有一个合理的值,这在预测中是有用的。 具有未知/缺失值的变量包括:“教育”、“工作”、“住房”、“贷款”、“耳聋”和“婚姻”。但重要的是“教育”、“工作”、“住房”和“贷款”。“婚姻”的未知数非常低。“default”变量的未知值被视为未知值。客户可能不愿意向银行代表披露此信息。因此,“default”中的未知值实际上是一个单独的值。 因此,我们首先为“教育”、“工作”、“住房”和“贷款”中的未知价值创造新的变量。我们这样做是为了查看这些值是否随机丢失,或者丢失的值中是否存在模式。
二、特征工程
1.创造新特征
从工作中推断教育:从交叉表中可以看出,从事管理工作的人通常拥有大学学位。因此,无论“工作”=管理,“教育”=未知,我们都可以用“大学学位”代替“教育”。同样,“工作”=“服务”-->“教育”=“高”。“学校”和“工作”=“女佣”-->“教育”。
根据教育推断工作:如果“教育”=“基本”。4y或基本。6y”或“基本”。那么“工作”通常是“蓝领”。如果“教育”=“专业”。“课程”,然后“工作”=“技术人员”。 根据年龄推断工作:如我们所见,如果“年龄”大于60岁,那么“工作”就是“退休”,这是有道理的。 在估算工作和教育的价值时,我们意识到了这样一个事实,即相关性应该具有现实意义。如果这在现实世界中没有意义,我们就不会替换缺失的值。
代码如下(示例):
df.loc[(df['age']>60) & (df['job']=='unknown'), 'job'] = 'retired'
df.loc[(df['education']=='unknown') & (df['job']=='management'), 'education'] = 'university.degree'
df.loc[(df['education']=='unknown') & (df['job']=='services'), 'education'] = 'high.school'
df.loc[(df['education']=='unknown') & (df['job']=='housemaid'), 'education'] = 'basic.4y'
df.loc[(df['job'] == 'unknown') & (df['education']=='basic.4y'), 'job'] = 'blue-collar'
df.loc[(df['job'] == 'unknown') & (df['education']=='basic.6y'), 'job'] = 'blue-collar'
df.loc[(df['job'] == 'unknown') & (df['education']=='basic.9y'), 'job'] = 'blue-collar'
df.loc[(df['job']=='unknown') & (df['education']=='professional.course'), 'job'] = 'technician'
jobhousing=cross_tab(df,'job','housing')
jobloan=cross_tab(df,'job','loan')

def fillhousing(df,jobhousing):
    """Function for imputation via cross-tabulation to fill missing values for the 'housing' categorical feature"""
    jobs=['housemaid','services','admin.','blue-collar','technician','retired','management','unemployed','self-employed','entrepreneur','student']
    house=["no","yes"]
    for j in jobs:
        ind=df[np.logical_and(np.array(df['housing']=='unknown'),np.array(df['job']==j))].index
        mask=np.random.rand(len(ind))<((jobhousing.loc[j]['no'])/(jobhousing.loc[j]['no']+jobhousing.loc[j]['yes']))
        ind1=ind[mask]
        ind2=ind[~mask]
        df.loc[ind1,"housing"]='no'
        df.loc[ind2,"housing"]='yes'
    return df

def fillloan(df,jobloan):
    """Function for imputation via cross-tabulation to fill missing values for the 'loan' categorical feature"""
    jobs=['housemaid','services','admin.','blue-collar','technician','retired','management','unemployed','self-employed','entrepreneur','student']
    loan=["no","yes"]
    for j in jobs:
        ind=df[np.logical_and(np.array(df['loan']=='unknown'),np.array(df['job']==j))].index
        mask=np.random.rand(len(ind))<((jobloan.loc[j]['no'])/(jobloan.loc[j]['no']+jobloan.loc[j]['yes']))
        ind1=ind[mask]
        ind2=ind[~mask]
        df.loc[ind1,"loan"]='no'
        df.loc[ind2,"loan"]='yes'
    return df

df=fillhousing(df,jobhousing)
df=fillloan(df,jobloan)

#展示新加入特征
df.head()
2.筛选特征
#本次就先选以下特征为变量
features_columns=['age', 'job', 'marital', 'education', 'balance', 'housing',
       'loan', 'contact', 'day', 'month', 'duration', 'campaign', 'pdays',
       'previous','education_un', 'job_un', 'housing_un',
       'loan_un','y']
将标签编码为数值:
#Encode the categorical data
for col in df.columns:
    if df[col].dtype==object:
        df[col]=df[col].astype('category')
        df[col]=df[col].cat.codes
三、数据归一化!!消除量纲影响并使数据呈正态分布,
是模型预测前必须要的一步!
# Rescale data (between 0 and 1)
import pandas
import scipy
import numpy
from sklearn.preprocessing import MinMaxScaler
features_columns_df=df[features_columns]
array = features_columns_df.values
# separate array into input and output components
X = array[:,0:15]
Y = array[:,15]
scaler = MinMaxScaler(feature_range=(0, 1))
rescaledX = scaler.fit_transform(X)
# summarize transformed data
numpy.set_printoptions(precision=3)
print(rescaledX[0:5,:])
四、模型预测
总结


