决策树系列(四)——基于决策树算法实现员工离职率预测
文章目录
- 基于决策树算法实现员工离职率预测
-
- 一、引入工具包
- 二、数据加载
- 三、数据预处理
-
- 3.1 重复值处理
- 3.2 缺失值处理
- 3.3 异常值处理
- 四、特征选择
-
- 4.1 删除明显无关特征
- 4.2 查看数值型特征相关性
- 4.3 类别型特征探索性分析
- 五、特征工程
-
- 类别型特征转换
- 六、模型训练
-
- 6.1 切分特征和标签
- 6.2 样本不均衡问题
- 6.3 切分训练集和测试集
- 6.4 模型训练
- 6.5 模型评估
- 6.6 使用网格搜索寻找最优参数对模型进行优化
- 6.7 使用最优参数建立模型
- 七、待补充
基于决策树算法实现员工离职率预测
问题描述:
我们有员工的各种统计信息,以及该员工是否已经离职,统计的信息包括了(工资、出差、工作环境满意度、工作投入度、是否加班、是否升职、工资提升比例等)现在需要你来通过训练数据得出 员工离职预测,并给出你在测试集上的预测结果。
数据集地址:https://www.kaggle.com/c/rs6-attrition-predict/data
数据说明:
训练数据和测试数据,保存在train.csv和test.csv文件中。训练集包括1176条记录,36个字段,字段说明如下:
| 字段 | 说明 | 字段 | 说明 |
|---|---|---|---|
| user_id | 用户ID,无意义特征 | MaritalStatus | 员工婚姻状况,Single单身,Married已婚,Divorced离婚 |
| Age | 员工年龄 | MonthlyIncome | 员工月收入,范围在1009到19999之间 |
| Attrition | 员工是否已经离职,Yes表示离职,No表示未离职 | MonthlyRate | 员工月收入 |
| BusinessTravel | 商务差旅预测,Non-Travel不出差,TravelRarely不经常出差,TravelFrequently经常出差 | NumCompaniesWorked | 员工曾经工作过的公司数 |
| DailyRate | 平均每日工资 | Over18 | 年龄是否超过18岁 |
| Department | 员工所在部门,Sales销售部,Research & Development研发部,Human | OverTime | 是否加班,Yes表示加班,No表示不加班 |
| DistanceFromHome | 公司跟家庭住址的距离,从1到29,1表示最近,29表示最远 | PercentSalaryHike | 工资提高的百分比 |
| Education | 员工的教育程度,从1到5,5表示教育程度最高 | PerformanceRating | 绩效评估 |
| EducationField | 员工所学习的专业领域 | RelationshipSatisfaction | 关系满意度,从1到4,1表示满意度最低,4表示满意度最高 |
| EmployeeCount | 雇员人数 | StandardHours | 标准工时 |
| EmployeeNumber | 工号 | StockOptionLevel | 股票期权水平 |
| EnvironmentSatisfaction | 员工对于工作环境的满意程度,从1到4,1的满意程度最低,4的满意程度最高 | TotalWorkingYears | 总工龄 |
| Gender | 员工性别,Male表示男性,Female表示女性 | TrainingTimesLastYear | 上一年的培训时长,从0到6,0表示没有培训,6表示培训时间最长 |
| HourlyRate | 每小时收入 | WorkLifeBalance | 工作与生活平衡程度,从1到4,1表示平衡程度最低,4表示平衡程度最高 |
| JobInvolvement | 员工工作投入度,从1到4,1为投入度最低,4为投入度最高 | YearsAtCompany | 在目前公司工作年数 |
| JobLevel | 职业级别,从1到5,1为最低级别,5为最高级别 | YearsInCurrentRole | 在目前工作职责的工作年数 |
| JobRole | 工作角色 | YearsSinceLastPromotion | 距离上次升职时长 |
| JobSatisfaction | 工作满意度,从1到4,1代表满意度最低,4代表最高 | YearsWithCurrManager | 跟目前的管理者共事年数 |
评分标准:AUC
一、引入工具包
import pandas as pd
import numpy as np
import matplotlib.pyplot as plt
import seaborn as sns

from sklearn.tree import DecisionTreeClassifier
from sklearn.model_selection import train_test_split,cross_val_score
from sklearn.metrics import roc_auc_score
from imblearn.over_sampling import SMOTE
from sklearn.model_selection import GridSearchCV
二、数据加载
data = pd.read_csv('../data/train.csv')
pd.set_option('display.max_columns', None)
data.head()
三、数据预处理
3.1 重复值处理
print("样本去重前样本数量:{}".format(data.shape[0]))
print("样本去重后样本数量:{}".format(data.drop_duplicates().shape[0]))

样本去重前样本数量:1176
样本去重后样本数量:1176
该数据集无重复数据
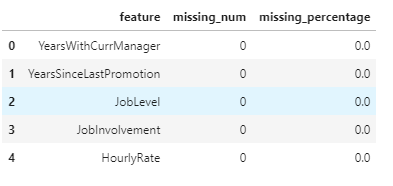
3.2 缺失值处理
missingDf = data.isnull().sum().sort_values(ascending = False).reset_index()
missingDf.columns = ['feature','missing_num']
missingDf['missing_percentage'] = missingDf['missing_num'] / data.shape[0]
missingDf.head()
3.3 异常值处理
筛选数值型特征
numeric_columns = []
object_columns = []
for c in data.columns:
    if data[c].dtype == 'object':
        object_columns.append(c)
    else:
        numeric_columns.append(c)
绘制箱型图查看异常值
fig = plt.figure(figsize=(20,30))
for i,col in enumerate(numeric_columns):
    ax = fig.add_subplot(9,3,i+1)
    sns.boxplot(data[col],orient='v',ax=ax)
    plt.xlabel(col)
plt.show()

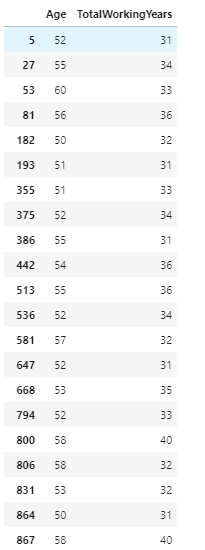
此处截取了一些可能存在异常值的数值型特征,经过观察后,发现EmployeeCount特征数据全为1,StandardHours特征数据全为80,这些特征对模型无影响,之后要删除掉。此外,其他特征检验后无明显异常。此处以TotalWorkingYears特征为例:
data[data['TotalWorkingYears'] > 30][['Age','TotalWorkingYears']]
四、特征选择
4.1 删除明显无关特征
data.describe()
- EmployeeCount和StandardHours方差都为0,符合异常值检测值中数据都一样的结论,需要删除
- user_id特征对模型无意义,需要删除
- Over18特征中数据值全为Yes,也予以删除。
data.drop(['user_id','EmployeeCount','EmployeeNumber','StandardHours','Over18'],axis=1,inplace=True)
4.2 查看数值型特征相关性
pearson_mat = data.corr(method='spearman')

plt.figure(figsize=(30,30))
ax = sns.heatmap(pearson_mat,square=True,annot=True,cmap='YlGnBu')
bottom, top = ax.get_ylim()
ax.set_ylim(bottom + 0.5, top - 0.5)
plt.show()
从图中可以看出,TotalWorkingYears(总工龄) 和 MonthlyIncome(月收入)相关性达到0.72,JobLevel(职业级别)和MonthlyIncome(月收入)相关性达到0.92,相关性很高。我们从常识来判断,月收入对员工离职的重要性是要大于其他两个特征的。所以,可以删除JobLevel和TotalWorkingYears两个特征,并认为月收入越高,员工级别越高,总工龄越高;
其次,YearsAtCompany(在目前公司工作年数) 和YearsInCurrentRole(在目前工作职责的工作年数) 、YearsWithCurrManager(跟目前的管理者共事年数)相关性过高,删除YearsInCurrentRole和YearsWithCurrManager两个特征。
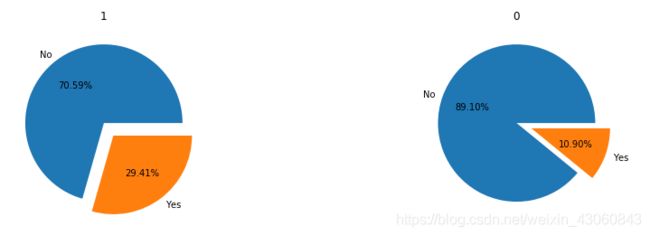
PerformanceRating 和PercentSalaryHike相关性也过高,且PerformanceRating不明显影响员工离职率,所以删除PerformanceRating特征。
# PerformanceRating:绩效评估
fig = plt.figure(figsize=(15,4)) # 建立图像
L1 = list(data['PerformanceRating'].unique())
for i,c in enumerate(L1):
    ax = fig.add_subplot(1,3,i+1)
    p = data[data['PerformanceRating'] == c]['Attrition'].value_counts()
    ax.pie(p,labels=['No','Yes'],autopct='%1.2f%%',explode=(0,0.2))
    ax.set_title(c)
plt.show() # 展示饼状图
data.drop(['JobLevel','TotalWorkingYears','YearsInCurrentRole','YearsWithCurrManager','PerformanceRating'],axis=1,inplace=True)
4.3 类别型特征探索性分析
商务差旅频率与是否离职的关系
# BusinessTravel:商务差旅频率
fig = plt.figure(figsize=(15,4)) # 建立图像
L1 = list(data['BusinessTravel'].unique())
for i,c in enumerate(L1):
    ax = fig.add_subplot(1,3,i+1)
    p = data[data['BusinessTravel'] == c]['Attrition'].value_counts()
    ax.pie(p,labels=['No','Yes'],autopct='%1.2f%%',explode=(0,0.2))
    ax.set_title(c)
plt.show() # 展示饼状图

可以看出,商务差旅数次数的增多对职工离职的影响也随之增大。出差月频繁,离职率越高。
加班与是否离职的关系
# OverTime
fig = plt.figure(figsize=(15,4)) # 建立图像
L1 = list(data['OverTime'].unique())
for i,c in enumerate(L1):
    ax = fig.add_subplot(1,2,i+1)
    p = data[data['OverTime'] == c]['Attrition'].value_counts()
    ax.pie(p,labels=['No','Yes'],autopct='%1.2f%%',explode=(0,0.2))
    ax.set_title(c)
plt.show() # 展示饼状图
工作满意度与是否离职的关系
# JobSatisfaction:工作满意度
fig = plt.figure(figsize=(20,8)) # 建立图像
L1 = list(data['JobSatisfaction'].unique())
for i,c in enumerate(L1):
    ax = fig.add_subplot(2,3,i+1)
    p = data[data['JobSatisfaction'] == c]['Attrition'].value_counts()
    ax.pie(p,labels=['No','Yes'],autopct='%1.2f%%',explode=(0,0.2))
    ax.set_title(c)
plt.show() # 展示饼状图
性别与是否离职的关系
# Gender
fig = plt.figure(figsize=(20,8)) # 建立图像
L1 = list(data['Gender'].unique())
for i,c in enumerate(L1):
    ax = fig.add_subplot(2,3,i+1)
    p = data[data['Gender'] == c]['Attrition'].value_counts()
    ax.pie(p,labels=['No','Yes'],autopct='%1.2f%%',explode=(0,0.2))
    ax.set_title(c)
plt.show() # 展示饼状图
 我认为性别可能对离职率有影响但是不大。女性员工离职率可能较大。
员工所在部门与是否离职的关系
# Department 员工所在部门
fig = plt.figure(figsize=(15,4)) # 建立图像
L1 = list(data['Department'].unique())
for i,c in enumerate(L1):
    ax = fig.add_subplot(1,3,i+1)
    p = data[data['Department'] == c]['Attrition'].value_counts()
    ax.pie(p,labels=['No','Yes'],autopct='%1.2f%%',explode=(0,0.2))
    ax.set_title(c)
plt.show() # 展示饼状图

销售部门和HR部门的离职率较高。如果HR部门离职率较高,那么公司也很难长久的维持其他部门员工。
员工所学习的专业领域与是否离职的关系
# EducationField 员工所学习的专业领域

fig = plt.figure(figsize=(20,8)) # 建立图像
L1 = list(data['EducationField'].unique())
for i,c in enumerate(L1):
    ax = fig.add_subplot(2,3,i+1)
    p = data[data['EducationField'] == c]['Attrition'].value_counts()
    ax.pie(p,labels=['No','Yes'],autopct='%1.2f%%',explode=(0,0.2))
    ax.set_title(c)
plt.show() # 展示饼状图
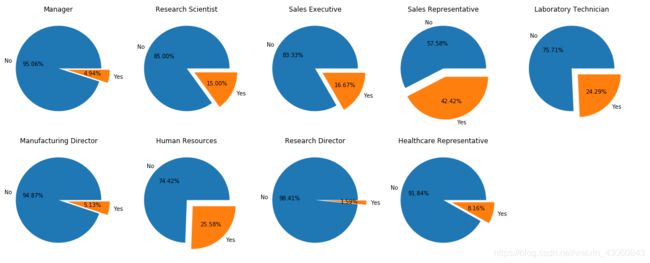
# JobRole
fig = plt.figure(figsize=(20,8)) # 建立图像
L1 = list(data['JobRole'].unique())
for i,c in enumerate(L1):
    ax = fig.add_subplot(2,5,i+1)
    p = data[data['JobRole'] == c]['Attrition'].value_counts()
    ax.pie(p,labels=['No','Yes'],autopct='%1.2f%%',explode=(0,0.2))
    ax.set_title(c)
plt.show() # 展示饼状图
员工的婚姻状况与是否离职的关系
# MaritalStatus
fig = plt.figure(figsize=(15,4)) # 建立图像
L1 = list(data['MaritalStatus'].unique())
for i,c in enumerate(L1):
    ax = fig.add_subplot(1,3,i+1)
    p = data[data['MaritalStatus'] == c]['Attrition'].value_counts()
    ax.pie(p,labels=['No','Yes'],autopct='%1.2f%%',explode=(0,0.2))
    ax.set_title(c)
plt.show() # 展示饼状图
五、特征工程
类别型特征转换
# Attrition
data['Attrition'] = data['Attrition'].apply(lambda x:1 if x == "Yes" else 0)

# Gender
data['Gender'] = data['Gender'].apply(lambda x:1 if x == "Male" else 0)

# OverTime
data['OverTime'] = data['OverTime'].apply(lambda x:1 if x == "Yes" else 0)
for fea in  ['BusinessTravel', 'Department', 'EducationField','JobRole','MaritalStatus']:
    labels = data[fea].unique().tolist()
    data[fea] = data[fea].apply(lambda x:labels.index(x))
六、模型训练
6.1 切分特征和标签
X = data.loc[:,data.columns != "Attrition"]
y = data['Attrition']
6.2 样本不均衡问题
y.value_counts()
0 988
1 188
Name: Attrition, dtype: int64
数据量过少,使用上采样处理
sm = SMOTE(random_state=20)
X, y = sm.fit_sample(X,y)
6.3 切分训练集和测试集
X = pd.DataFrame(X)
y = pd.DataFrame(y)

Xtrain,Xtest,Ytrain,Ytest = train_test_split(X, y ,test_size = 0.3,random_state=0)
6.4 模型训练
model = DecisionTreeClassifier(random_state=0)
model.fit(Xtrain,Ytrain)
pred = model.predict(Xtest)
6.5 模型评估
y_pred_prob = model.predict_proba(Xtest)[:, 1]
auc_score = roc_auc_score(Ytest,y_pred_prob)#验证集上的auc值
auc_score
0.838745131090408
6.6 使用网格搜索寻找最优参数对模型进行优化
gini_thresholds = np.linspace(0,0.5,20)

parameters = {
    'splitter':('best','random')
    ,'criterion':("gini","entropy")
    ,"max_depth":[*range(1,10)]
    ,'min_samples_leaf':[*range(1,50,5)]
    ,'min_impurity_decrease':[*np.linspace(0,0.5,20)]
}
clf = DecisionTreeClassifier(random_state=25)
GS = GridSearchCV(clf, parameters, cv=10,scoring='roc_auc')
GS.fit(Xtrain,Ytrain)
最优评分:
GS.best_score_
0.9235445387585528
最优参数:
GS.best_params_
{‘criterion’: ‘gini’,
‘max_depth’: 9,
‘min_impurity_decrease’: 0.0,
‘min_samples_leaf’: 11,
‘splitter’: ‘best’}
6.7 使用最优参数建立模型
model = DecisionTreeClassifier(random_state=0,criterion='gini',max_depth=9,min_impurity_decrease=0,min_samples_leaf=11,splitter='best')
model.fit(Xtrain,Ytrain)
model.score(Xtest,Ytest)
0.8549747048903878
pred = model.predict(Xtest)
y_pred_prob = model.predict_proba(Xtest)[:, 1]
auc_score = roc_auc_score(Ytest,y_pred_prob)#验证集上的auc值
auc_score
0.9232078995922646
七、待补充
- 年龄、收入等连续型特征可以分箱处理
- 删除过多特征,可以尝试特征组合,是否会有更好的模型表现
- 根据分析结果进行业务决策支持


