神经网络拟合二元函数曲面实践
简介
Andrew Ng 深度学习课程的第一周第三次作业是实现一个浅层神经网络,课程方给的框架很有意思,但该作业的输出是类别,我想实践一下该网络能否改造用来解决回归问题,具体而言是拟合一个函数z = x2+y2 ,尝试之后发现效果不是很稳定,容易收敛到局部极小值,但拟合效果大体上还能接受,简要分享,后续准备改用随机梯度下降方法来跳出局部极小值。
神经网络结构
因为是二元函数,所以输入层维度固定为2,输出层维度为1,输出层未采用激活函数,隐藏层只用了一层,设置了20个神经元,激活函数为tanh。误差函数使用均方误差函数,学习率设置为0.2。
拟合效果
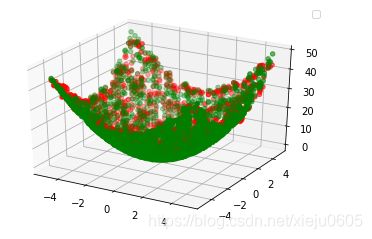
绿色点是原始曲面,红色点是拟合曲面。

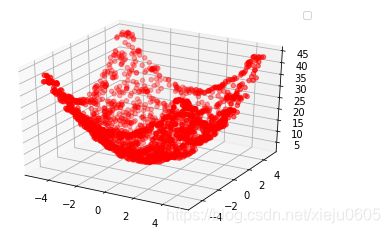
这样看可能看不出拟合的效果,放一张单独只有拟合曲面的图。

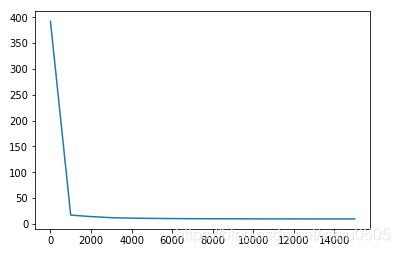
大体上还是拟合出来了,放上误差曲线。每1000次迭代取一次误差,不是很光滑,但能说明问题。

代码
下面是基本代码,框架用的是作业中提供的框架,针对连续数值的输出,我对网络结构和前向传播、后向传播做了适当修改。
# Package imports
import numpy as np
import matplotlib.pyplot as plt
import random
from matplotlib import cm
import mpl_toolkits.mplot3d
np.random.seed(2)


def layer_sizes(X, Y):
    """
    Arguments:
    X -- input dataset of shape (input size, number of examples)
    Y -- labels of shape (output size, number of examples)

    Returns:
    n_x -- the size of the input layer
    n_h -- the size of the hidden layer
    n_y -- the size of the output layer
    """
    ### START CODE HERE ### (≈ 3 lines of code)
    n_x = X.shape[0] # size of input layer
    n_y = Y.shape[0] # size of output layer
    ### END CODE HERE ###
    return (n_x,  n_y)


def initialize_parameters(n_x, n_h, n_y):
    """
    Argument:
    n_x -- size of the input layer
    n_h -- size of the hidden layer
    n_y -- size of the output layer

    Returns:
    params -- python dictionary containing your parameters:
                    W1 -- weight matrix of shape (n_h, n_x)
                    b1 -- bias vector of shape (n_h, 1)
                    W2 -- weight matrix of shape (n_y, n_h)
                    b2 -- bias vector of shape (n_y, 1)
    """

    np.random.seed(20)

    ### START CODE HERE ### (≈ 4 lines of code)
    W1 = np.random.randn(n_h, n_x)* 0.01
    b1 = np.zeros((n_h, 1))
    W2 = np.random.randn(n_y, n_h)* 0.01
    b2 = np.zeros((n_y, 1))
    ### END CODE HERE ###

    parameters = {"W1": W1,
                  "b1": b1,
                  "W2": W2,
                  "b2": b2}

    return parameters

def forward_propagation(X, parameters):
    """
    Argument:
    X -- input data of size (n_x, m)
    parameters -- python dictionary containing your parameters (output of initialization function)

    Returns:
    A2 -- The sigmoid output of the second activation
    cache -- a dictionary containing "Z1", "A1", "Z2" and "A2"
    """
    # Retrieve each parameter from the dictionary "parameters"
    ### START CODE HERE ### (≈ 4 lines of code)
    W1 = parameters['W1']
    b1 = parameters['b1']
    W2 = parameters['W2']
    b2 = parameters['b2']
    ### END CODE HERE ###

    # Implement Forward Propagation to calculate A2 (probabilities)
    ### START CODE HERE ### (≈ 4 lines of code)
    Z1 = np.dot(W1, X) + b1
    A1 = np.tanh(Z1)
    Z2 = np.dot(W2, A1) + b2
    A2 = Z2
    ### END CODE HERE ###

    cache = {"Z1": Z1,
             "A1": A1,
             "Z2": Z2,
             "A2": A2}

    return A2, cache

def compute_cost(A2, Y, parameters):
    """
    Computes the cross-entropy cost given in equation (13)

    Arguments:
    A2 -- The sigmoid output of the second activation, of shape (1, number of examples)
    Y -- "true" labels vector of shape (1, number of examples)
    parameters -- python dictionary containing your parameters W1, b1, W2 and b2

    Returns:
    cost -- cross-entropy cost given equation (13)
    """

    m = Y.shape[1] # number of example
    cost = np.sum(np.square(A2-Y))/m

    cost = np.squeeze(cost)     # makes sure cost is the dimension we expect.
                                # E.g., turns [[17]] into 17

    return cost


def backward_propagation(parameters, cache, X, Y):
    """
    Implement the backward propagation using the instructions above.

    Arguments:
    parameters -- python dictionary containing our parameters
    cache -- a dictionary containing "Z1", "A1", "Z2" and "A2".
    X -- input data of shape (2, number of examples)
    Y -- "true" labels vector of shape (1, number of examples)

    Returns:
    grads -- python dictionary containing your gradients with respect to different parameters
    """
    m = X.shape[1]

    # First, retrieve W1 and W2 from the dictionary "parameters".
    ### START CODE HERE ### (≈ 2 lines of code)
    W1 = parameters['W1']
    W2 = parameters['W2']
    ### END CODE HERE ###

    # Retrieve also A1 and A2 from dictionary "cache".
    ### START CODE HERE ### (≈ 2 lines of code)
    A1 = cache['A1']
    A2 = cache['A2']
    ### END CODE HERE ###

    # Backward propagation: calculate dW1, db1, dW2, db2.
    ### START CODE HERE ### (≈ 6 lines of code, corresponding to 6 equations on slide above)
    dZ2 =( A2 - Y)
    dW2 = 1/m * np.dot(dZ2, A1.T)
    db2 = 1/m * np.sum(dZ2, axis=1, keepdims=True)
    dZ1 = np.dot(W2.T, dZ2) * (1 - np.power(A1, 2))
    dW1 = 1/m * np.dot(dZ1, X.T)
    db1 = 1/m * np.sum(dZ1, axis=1, keepdims=True)
    ### END CODE HERE ###

    grads = {"dW1": dW1,
             "db1": db1,
             "dW2": dW2,
             "db2": db2}

    return grads

def update_parameters(parameters, grads, learning_rate = 0.2):
    """
    Updates parameters using the gradient descent update rule given above

    Arguments:
    parameters -- python dictionary containing your parameters
    grads -- python dictionary containing your gradients

    Returns:
    parameters -- python dictionary containing your updated parameters
    """
    # Retrieve each parameter from the dictionary "parameters"
    ### START CODE HERE ### (≈ 4 lines of code)
    W1 = parameters['W1']
    b1 = parameters['b1']
    W2 = parameters['W2']
    b2 = parameters['b2']
    ### END CODE HERE ###

    # Retrieve each gradient from the dictionary "grads"
    ### START CODE HERE ### (≈ 4 lines of code)
    dW1 = grads["dW1"]
    db1 = grads["db1"]
    dW2 = grads["dW2"]
    db2 = grads["db2"]
    ## END CODE HERE ###

    # Update rule for each parameter
    ### START CODE HERE ### (≈ 4 lines of code)
    W1 -= learning_rate * dW1
    b1 -= learning_rate * db1
    W2 -= learning_rate * dW2
    b2 -= learning_rate * db2
    ### END CODE HERE ###

    parameters = {"W1": W1,
                  "b1": b1,
                  "W2": W2,
                  "b2": b2}

    return parameters

def nn_model(X, Y, n_h, num_iterations = 10000, print_cost=False):
    """
    Arguments:
    X -- dataset of shape (2, number of examples)
    Y -- labels of shape (1, number of examples)
    n_h -- size of the hidden layer
    num_iterations -- Number of iterations in gradient descent loop
    print_cost -- if True, print the cost every 1000 iterations

    Returns:
    parameters -- parameters learnt by the model. They can then be used to predict.
    """

    np.random.seed(3)
    n_x = layer_sizes(X, Y)[0]
    n_y = layer_sizes(X, Y)[1]

    # Initialize parameters, then retrieve W1, b1, W2, b2. Inputs: "n_x, n_h, n_y". Outputs = "W1, b1, W2, b2, parameters".
    ### START CODE HERE ### (≈ 5 lines of code)
    n_x, n_y = layer_sizes(X, Y)
    parameters = initialize_parameters(n_x, n_h, n_y)
    W1 = parameters['W1']
    b1 = parameters['b1']
    W2 = parameters['W2']
    b2 = parameters['b2']
    ### END CODE HERE ###

    # Loop (gradient descent)

    for i in range(0, num_iterations):

        ### START CODE HERE ### (≈ 4 lines of code)
        # Forward propagation. Inputs: "X, parameters". Outputs: "A2, cache".
        A2, cache = forward_propagation(X, parameters)

        # Cost function. Inputs: "A2, Y, parameters". Outputs: "cost".
        cost = compute_cost(A2, Y, parameters)

        # Backpropagation. Inputs: "parameters, cache, X, Y". Outputs: "grads".
        grads = backward_propagation(parameters, cache, X, Y)

        # Gradient descent parameter update. Inputs: "parameters, grads". Outputs: "parameters".
        parameters = update_parameters(parameters, grads)

        ### END CODE HERE ###

        # Print the cost every 1000 iterations
        if print_cost and i % 1000 == 0:
            print ("Cost after iteration %i: %f" %(i, cost))

    return parameters

def predict(parameters, X):
    """
    Using the learned parameters, predicts a class for each example in X

    Arguments:
    parameters -- python dictionary containing your parameters
    X -- input data of size (n_x, m)

    Returns
    predictions -- vector of predictions of our model (red: 0 / blue: 1)
    """
    ### START CODE HERE ### (≈ 2 lines of code)
    A2, cache = forward_propagation(X, parameters)

    predictions = A2
    ### END CODE HERE ###

    return predictions

#训练集和测试集生成
if __name__ == '__main__':
	train_data = np.zeros((10000,3))
	for i in range(10000):
	    train_data[i][0] = random.uniform(-5, 5)
	    train_data[i][1] = random.uniform(-5, 5)
	    train_data[i][2] = train_data[i][0]**2 + train_data[i][1]**2
	X = train_data[:,0:2].T
	y = train_data[:,2].reshape(10000,1).T

	parameters = nn_model(X, y, n_h = 20, num_iterations = 20000, print_cost=True)


	test_data = np.zeros((2000,4))
	for i in range(2000):
	    test_data[i][0] = random.uniform(-5, 5)
	    test_data[i][1] = random.uniform(-5, 5)
	    test_data[i][2] = test_data[i][0]**2 + test_data[i][1]**2
	x = test_data[:,0:2].T
	predictions = predict(parameters, x)
	for i in range(2000):
	    test_data[i][3] = predictions[0][i]

	ax = plt.subplot(111, projection='3d')  # 创建一个三维的绘图工程
	  #将数据点分成三部分画,在颜色上有区分度
	ax.scatter(test_data[:,0], test_data[:,1], test_data[:,2], c='g')
	ax.scatter(test_data[:,0], test_data[:,1], test_data[:,3], c='r')
	plt.legend()
	plt.show()