python绘图——坐标轴
1. 2D坐标轴
1.1 绘制简单的曲线
import matplotlib.pyplot as plt
import numpy as np
x=np.linspace(-1,1,50)#-1到1中画50个点
y=x**2
plt.plot(x,y,color='green')
plt.tick_params(axis='x',colors='blue')
plt.tick_params(axis='y',colors='red')
plt.show()
1.2 坐标轴的刻度线向内
import matplotlib.pyplot as plt
import numpy as np
x=np.linspace(-1,1,50)#-1到1中画50个点
y=x**2
# 下面两行代码要放在plt.plot的前面
plt.rcParams['xtick.direction'] = 'in'#将x轴的刻度线方向设置向内
plt.rcParams['ytick.direction'] = 'in'#将y轴的刻度线方向设置向内

plt.plot(x,y,color='green')
plt.tick_params(axis='x',colors='blue')
plt.tick_params(axis='y',colors='red')
plt.show()
1.3 将坐标刻度从整0开始
plt.margins(x=0)
plt.margins(y=0)

#设置坐标轴范围
#plt.ylim([0,0.8])
#plt.xlim([0,0.75])
1.4 设置刻度栅格
简单的刻度:
plt.grid()
主刻度和次刻度
import matplotlib.pyplot as plt
import numpy as np
plt.figure(figsize=(17,3))
ax = plt.gca()
ax.xaxis.set_major_locator(plt.MultipleLocator(0.2))    #设置x轴主刻度
ax.xaxis.set_minor_locator(plt.MultipleLocator(0.04))   #设置x轴次刻度
ax.yaxis.set_major_locator(plt.MultipleLocator(0.5))    #设置x轴次刻度
ax.yaxis.set_minor_locator(plt.MultipleLocator(0.1))    #设置x轴次刻度
ax.grid(which='major',axis="both",linewidth=0.75,linestyle='-',color='r')
ax.grid(which='minor',axis="both",linewidth=0.25,linestyle='-',color='r')
x=np.linspace(0,3*np.pi,50)#-1到1中画50个点
y=2*np.sin(x)
plt.plot(x,y)
plt.margins(x=0)
plt.margins(y=0)
plt.show()
下面的图形类似于心电图纸绘制,关于心电图相关的绘制,具体在使用python绘制心电图中体现:

1.5 不显示坐标
只是坐标刻度不可见,两种方式的效果一样
# plt.xticks([])
plt.yticks([])

# 或者下面的
# frame.axes.get_xaxis().set_visible(False) # x 轴不可见
frame.axes.get_yaxis().set_visible(False) # y 轴不可见
plt.axis('off')
1.6 坐标值
为坐标设置刻度值, 并且将刻度值旋转45度
import matplotlib.pyplot as plt
import numpy as np
x=np.linspace(0,2,50)#-1到1中画50个点
y=x**2
plt.rcParams['xtick.direction'] = 'in'#将x轴的刻度线方向设置向内
plt.rcParams['ytick.direction'] = 'in'#将y轴的刻度线方向设置向内
ax = plt.gca()
xlabel=[str(val)+'_1' for val in range(100,110)]
ax.set_xticklabels(xlabel)
plt.xticks(rotation = 45)
plt.plot(x,y,color='green')
plt.tick_params(axis='x',colors='blue')
plt.tick_params(axis='y',colors='red')
plt.margins(x=0)
plt.margins(y=0)
plt.show()
1.7 绘制横线和竖线
plt.axvline(1)
plt.axhline(1.5)
1.8 设置坐标点的颜色
下图中设置y轴第3个坐标值的颜色为黄色,x轴第6个坐标值颜色为绿色。
import matplotlib.pyplot as plt
import numpy as np
x=np.linspace(0,2,50)#-1到1中画50个点
y=x**2
plt.rcParams['xtick.direction'] = 'in'#将x轴的刻度线方向设置向内
plt.rcParams['ytick.direction'] = 'in'#将y轴的刻度线方向设置向内
ax = plt.gca()
plt.plot(x,y,color='green')
plt.tick_params(axis='x',colors='blue')
plt.tick_params(axis='y',colors='red')
ax.get_yticklabels()[3].set_color("y")
ax.get_xticklabels()[6].set_color("g")
plt.show()
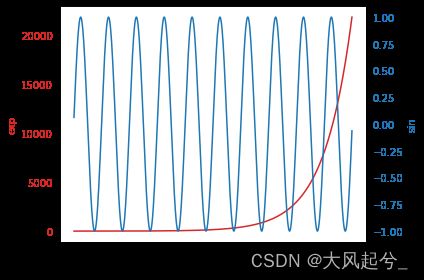
1.9 双坐标
代码如下:
import numpy as np
import matplotlib.pyplot as plt

t = np.arange(0.01, 10.0, 0.01)
data1 = np.exp(t)
data2 = np.sin(2 * np.pi * t)

fig, ax1 = plt.subplots()

color = 'tab:red'
ax1.set_xlabel('time (s)')
ax1.set_ylabel('exp', color=color)
ax1.plot(t, data1, color=color)
ax1.tick_params(axis='y', labelcolor=color)

ax2 = ax1.twinx()  # instantiate a second axes that shares the same x-axis

color = 'tab:blue'
ax2.set_ylabel('sin', color=color)  # we already handled the x-label with ax1
ax2.plot(t, data2, color=color)
ax2.tick_params(axis='y', labelcolor=color)

fig.tight_layout()  # otherwise the right y-label is slightly clipped
plt.show()
2. 3D坐标轴
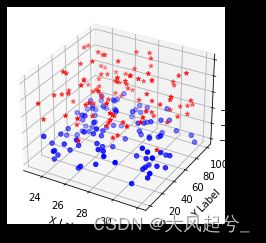
2.1 绘制3D散点图
关键代码ax.scatter(xs, ys, zs, c=c, marker=m),输入数据xs,ys,zs是相同长度的一维数据。c是颜色,marker是散点类型。
from mpl_toolkits.mplot3d import Axes3D
import matplotlib.pyplot as plt
import numpy as np
def randrange(n, vmin, vmax):
    return (vmax - vmin)*np.random.rand(n) + vmin
fig = plt.figure()
ax = fig.add_subplot(111, projection='3d')

n = 100
for c, m, zlow, zhigh in [('r', '*', -10, 20), ('b', 'o', -30, -10)]:
    xs = randrange(n, 23, 32)
    ys = randrange(n, 0, 100)
    zs = randrange(n, zlow, zhigh)
    ax.scatter(xs, ys, zs, c=c, marker=m)
ax.set_xlabel('X Label')
ax.set_ylabel('Y Label')
ax.set_zlabel('Z Label')
plt.show()
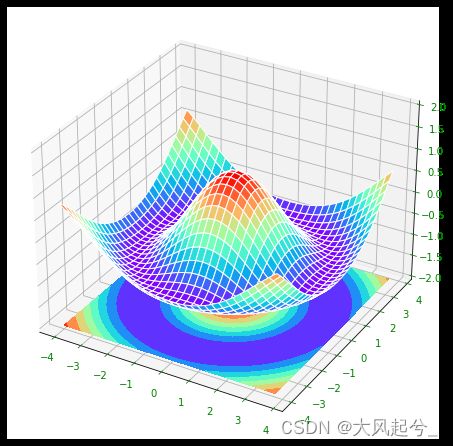
2.2 绘制3D曲面图
import numpy as np
import matplotlib.pyplot as plt
from mpl_toolkits.mplot3d import Axes3D

fig=plt.figure(num=1,figsize=(8,6))
ax = Axes3D(fig)
X = np.arange(-4, 4, 0.25)
Y = np.arange(-4, 4, 0.25)
X, Y = np.meshgrid(X, Y)
R = np.sqrt(X ** 2 + Y ** 2)
# height value
Z = np.cos(R)
ax.plot_surface(X, Y, Z, rstride=1, cstride=1, cmap=plt.get_cmap('rainbow'),edgecolors='white')
ax.contourf(X, Y, Z, zdir='z', offset=-2, cmap=plt.get_cmap('rainbow'))#投影等高线,改变zdir='x', offset=-4实现投影到不同坐标轴
ax.set_zlim(-2, 2)
ax.tick_params(axis='x',colors='g')
ax.tick_params(axis='y',colors='g')
ax.tick_params(axis='z',colors='g')
plt.show()
2.3 绘制3D柱形图
import numpy as np
import matplotlib.pyplot as plt
from mpl_toolkits.mplot3d import Axes3D
from matplotlib import cm

X=np.arange(0, 9, step=1)#X轴的坐标
Y=np.arange(0, 10, step=1)#Y轴的坐标
arr = [[np.random.randint(1,50) for i in range(9)] for i in range(10)]
Z = np.array(arr)

xx, yy=np.meshgrid(X, Y)#网格化坐标
X, Y=xx.ravel(), yy.ravel()#矩阵扁平化
bottom=np.zeros_like(X)#设置柱状图的底端位值
Z=Z.ravel()#扁平化矩阵

width=height=0.8#每一个柱子的长和宽
#绘图设置
fig=plt.figure()
ax=fig.gca(projection='3d')#三维坐标轴
ax.bar3d(X, Y, bottom, width, height, Z, shade=True,color='lightgreen')#
#坐标轴设置
ax.set_xlabel('X')
ax.set_ylabel('Y')
ax.set_zlabel('Z')
plt.show()
引用
[1]Matplotlib 文档
[2]python绘制三维图
[3]python-绘制3D柱形图
[4]Python + matplotlib更改纵横坐标刻度颜色
[5]Python绘图总结(Matplotlib篇)之坐标轴及刻度


