KITTI自动驾驶数据集可视化教程

本文介绍关于自动驾驶数据集KITTI的基本操作,包括Camera和LiDAR可视化教程,源码已上传:https://download.csdn.net/download/cg129054036/20907604
1. 数据准备
将 KITTI 数据 (calib, image_2, label_2, velodyne) 添加到 dataset/KITTI/object/training文件夹下。
目录文件结构如下:
├── dataset
│   ├── KITTI
│   │   ├── object
│   │   │   ├──KITTI
│   │   │      ├──ImageSets
│   │   │   ├──training
│   │   │      ├──calib & velodyne & label_2 & image_2
├── kitti_object.py
├── kitti_test.py
├── kitti_util.py
├── viz_util.py
2. Requirements
为了显示物体 2D bbox 和 3D bbox,Ubuntu系统需要安装以下工具:
- mayavi
- pillow
- vtk
- opencv
- PIL
- matplotlib
- numpy
3. 可视化操作
下面依次展示 KITTI 数据集可视化结果,可视化操作代码存放在 kitti_test.py 文件中,这里通过设置 data_idx=10 来展示编号为000010的数据,共有9种可视化操作,依次为:
- 图片显示
- 图片上绘制2D bbox
- 图片上绘制3D bbox
- Lidar在图片上投影
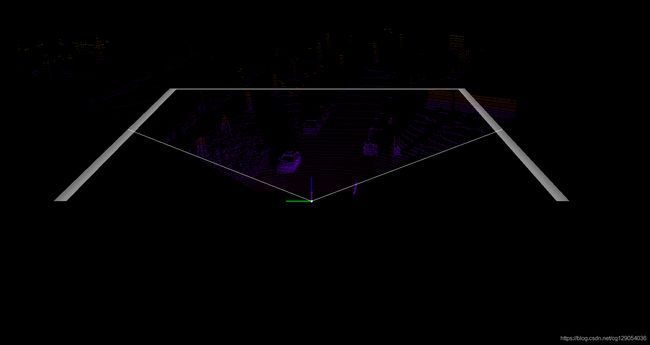
- LidarFOV图
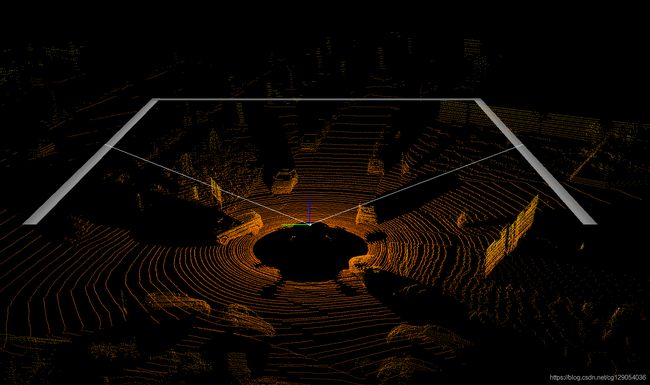
- Lidar三维可视化
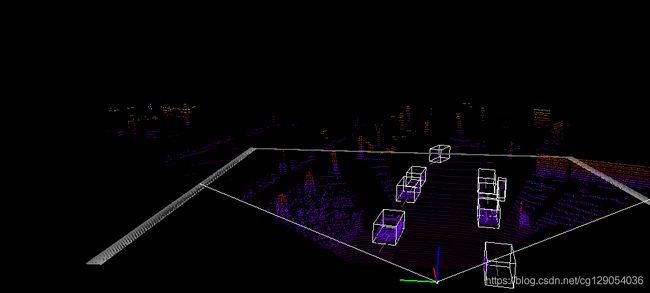
- Lidar绘制3D bbox
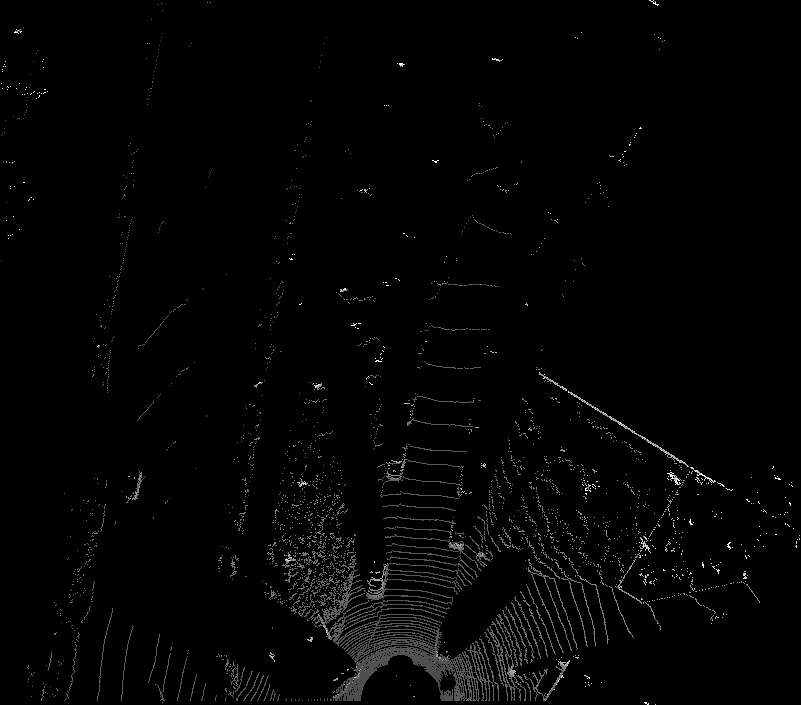
- Lidar鸟瞰图
- Lidar鸟瞰图绘制2D bbox
代码中dataset需要修改为数据集实际路径。
def visualization():
    import mayavi.mlab as mlab
    dataset = kitti_object(os.path.join(ROOT_DIR, '../dataset/KITTI/object'))

    # determine data_idx
    data_idx = 10

    # Load data from dataset
    objects = dataset.get_label_objects(data_idx)
    print("There are %d objects.", len(objects))
    img = dataset.get_image(data_idx)
    img = cv2.cvtColor(img, cv2.COLOR_BGR2RGB)
    img_height, img_width, img_channel = img.shape
    pc_velo = dataset.get_lidar(data_idx)[:,0:3]
    calib = dataset.get_calibration(data_idx)
(1) 图片显示
Image.fromarray(img).show()
这里KITTI 数据集给出了目标在图片上的坐标位置 (Xmin, Ymin, Xmax, Ymax),直接绘图即可。
show_image_with_boxes(img, objects, calib, False)
绘制物体 3D bbox时,需要进行坐标系转换,KITTI 数据集中给出的是物体在相机坐标系的位置 (x,y,z),根据物体 bbox 尺寸(h,w,l) 首先计算 3D bbox 8个顶点坐标,然后借助标定文件将其转换为图片坐标系坐标 (u, v)。
show_image_with_boxes(img, objects, calib, True)
将 Lidar 坐标下各 point 坐标转换为图片坐标系下坐标,然后根据图片尺寸选取投影点。
show_lidar_on_image(pc_velo, img, calib, img_width, img_height)
imgfov_pc_velo, pts_2d, fov_inds = get_lidar_in_image_fov(pc_velo, calib, 0, 0, img_width, img_height, True)
draw_lidar(imgfov_pc_velo, show=True)
draw_lidar(pc_velo, show=True)
绘制Lidar3D bbox时,需要进行坐标系转换,KITTI 数据集中给出的是物体在相机坐标系的位置(x,y,z),这里借助标定文件将其转换为Lidar坐标系下位置,同时借助物体bbox 尺寸(h,w,l)计算3D框8个顶点坐标。
show_lidar_with_boxes(pc_velo, objects, calib, True, img_width, img_height)
鸟瞰图绘制时将点云数据进行了预处理,只选取 x 坐标位于[0,70.4],y坐标位于[-40,40]的有效点。
show_lidar_topview(pc_velo, objects, calib)
绘制时为了区分物体距激光雷达距离,将30米内目标使用绿色标志,30米-50米内目标使用红色标志,50米以外目标使用蓝色标志(场景0000010无此距离目标。)
img1 = cv2.imread('000010_BEV.png')
img = cv2.cvtColor(img1, cv2.COLOR_BGR2RGB)
show_lidar_topview_with_boxes(img1, objects, calib)


