卷积神经网络 - CNN 用一维心电图信号说明
介绍
生物医学信号在研究和数据科学领域始终发挥着重要作用。就卷积神经网络 (CNN) 而言,这种特殊算法在定义深度学习 (DL) 等最复杂和最高级算法的架构方面发挥着重要作用。
谈到深度学习,大多数开源编码与图像类型相关,属于二维数据(关于维度细节及其类型相关请参阅:https://www.analyticsvidhya.com/blog/2021/07/artificial-neural-network-simplified-with-1-d-ecg-biomedical-data)
这篇特别的文章给出了一个一维数据的清晰画面,以及我们需要从二维数据或一维数据中使用哪些基本层。
卷积神经网络
我们已经在下面的文章中详细讨论了卷积神经网络 (CNN),其中包含带有 Python 代码的图像处理领域(与计算机视觉相关)。请查看链接以获得更好的理解:
https://www.analyticsvidhya.com/blog/2021/07/convolution-neural-network-better-understanding/
在简单的 CNN 中可以解释为,
CNN 算法的一些重要层或步骤,
卷积层(CNN中最重要的层)
激活函数(Boosting power,尤其是ReLu层)
池化(像PCA一样降维)
Flattening(将矩阵形式转换为单个大列)
激活层——SOFTMAX层(主要是输出层,概率分布)
全连接(取决于目标/因变量)
二维到一维数据
对于 CNN,我们将使用一些基本层,它们为 LeNet 5、Alexnet、Inception 等大多数算法奠定了基础,例如我们将使用的图像分析,一些基本块或基本的部分,我也给了如何在一维数据中使用的方法,
卷积层——Conv2D(二维)——Conv1D(一维)
最大池层——MaxPool2D(二维)——MaxPool1D(一维)
展平层——Flattening(1维和2维)
Drop-Out 层——Dropout(一维和二维)
全连接层&输出层——Dense
从上面的讨论我们可以得出结论,在功能方面不会有任何区别,但在特定于应用程序方面有点不同。
这是我们在将数据集提供给模型/特征提取过程之前在编写代码时需要保留的另一个最重要的概念,我们的数据应该是
上述归一化过程截图概念的来源是:
https://github.com/anandprems/cnn/blob/main/cnn_cifar10.ipynb
谈到图像,对于像 ECG 这样的一维数据或任何时间序列数据,我们需要为 DL 算法格式重塑我们的数据,
图片来源:作者
上述重塑过程截图的概念取自一维数据,
https://github.com/anandprems/mitbih_cnn/blob/main/mitbih_cnn.ipynb
第一维指的是输入样本
第二维是指样品的长度
第三个维度是指通道数
相同的条件,但对于 LSTM(循环神经网络),
第一维——样品
第二维——时间步长
第三维——特征
我们从上述条件推断,输入层需要一个 3 维数据数组来进一步处理数据建模或模型提取。
心电图数据
Physionet 是世界著名的开源生物信号数据(心电图、脑电图、PPG 或其他),使用实时数据集总是很冒险的,因此我们可以监控我们的模型如何开始与实时数据一起工作。
我们的理想/开源数据需要时间和调整。这里我们从 www.physionet.org 获取数据库,我们有一个不同的特定疾病数据库,其中,我更喜欢使用 MIT-BIH 心律失常数据库,一个主要原因是它是多分类的而不是二分类的。
重要规格——所有记录均以 360 Hz 和11 位分辨率采样。
数据集:https : //www.physionet.org/content/mitdb/1.0.0/
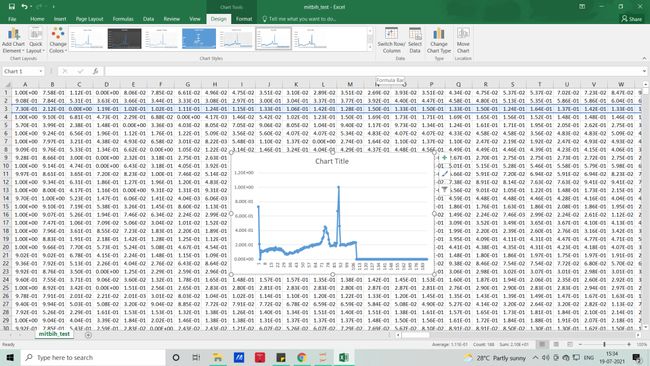
我们在本文中使用的信号将类似于下图,无需编码,借助 MS EXCEL,我们可以可视化数据集的样子
每一行代表一个样本,每一列代表样本每秒的变化状态(这里是 188 个),如果你想可视化它(PQRST-U 波形 - 原始信号),你可以用 excel 或借助python代码来实现。
Python 代码——CNN
#importing libraries
import numpy as np
import pandas as pd
import matplotlib.pyplot as plt
#importing datasets
test = pd.read_csv('mitbih_test.csv')
train = pd.read_csv('mitbih_train.csv')#viewing normal dataset
test.head()#viewing abnormal dataset
train.head()#dimenion for normal
test.shape#dimension for abnormal
train.shape#changing the random column names to sequential - normal
#as we have some numbers name as columns we need to change that to numbers as
for trains in train:
train.columns = list(range(len(train.columns)))#viewing edited columns for normal data
train.head()#changing the random column names to sequential - abnormal
#as we have some numbers name as columns we need to change that to numbers as
for tests in test:
test.columns = list(range(len(test.columns)))#viewing edited columns for abnormal data
test.head()#combining two data into one
#suffling the dataset and dropping the index
#As when concatenating we all have arranged 0 and 1 class in order manner
dataset = pd.concat([train, test], axis=0).sample(frac=1.0, random_state =0).reset_index(drop=True)#viewing combined dataset
dataset.head()dataset.shape#basic info of statistics
dataset.describe()#basic information of dataset
dataset.info()#viewing the uniqueness in dataset
dataset.nunique()#skewness of the dataset
#the deviation of the distribution of the data from a normal distribution
#+ve mean > median > mode
#-ve mean < median < mode
dataset.skew()#kurtosis of dataset
#identifies whether the tails of a given distribution contain extreme values
#Leptokurtic indicates a positive excess kurtosis
#mesokurtic distribution shows an excess kurtosis of zero or close to zero
#platykurtic distribution shows a negative excess kurtosis
dataset.kurtosis()#missing values any from the dataset
print(str('Any missing data or NaN in the dataset:'), dataset.isnull().values.any())#data ranges in the dataset - sample
print("The minimum and maximum values are {}, {}".format(np.min(dataset.iloc[-2,:].values), np.max(dataset.iloc[-2,:].values)))#correlation for all features in the dataset
correlation_data =dataset.corr()
print(correlation_data)import seaborn as sns
#visulaization for correlation
plt.figure(figsize=(10,7.5))
sns.heatmap(correlation_data, annot=True, cmap='BrBG')#for target value count
label_dataset = dataset[187].value_counts()
label_dataset#visualization for target label
label_dataset.plot.bar()#splitting dataset to dependent and independent variable
X = dataset.iloc[:,:-1].values #independent values / features
y = dataset.iloc[:,-1].values #dependent values / target#checking imbalance of the labels
from collections import Counter
counter_before = Counter(y)
print(counter_before)#applying SMOTE for imbalance
from imblearn.over_sampling import SMOTE
oversample = SMOTE()
X, y = oversample.fit_resample(X, y)#after applying SMOTE for imbalance condition
counter_after = Counter(y)
print(counter_after)#splitting the datasets for training and testing process
from sklearn.model_selection import train_test_split
X_train, X_test, y_train, y_test = train_test_split(X, y, test_size =0.3, random_state=42)#size for the sets
print('size of X_train:', X_train.shape)
print('size of X_test:', X_test.shape)
print('size of y_train:', y_train.shape)
print('size of y_test:', y_test.shape)深度学习算法
卷积神经网络
#CNN
from tensorflow.keras.layers import Flatten, Dense, Conv1D, MaxPool1D, Dropout
#Reshape train and test data to (n_samples, 187, 1), where each sample is of size (187, 1)
X_train = np.array(X_train).reshape(X_train.shape[0], X_train.shape[1], 1)
X_test = np.array(X_test).reshape(X_test.shape[0], X_test.shape[1], 1)print("X Train shape: ", X_train.shape)
print("X Test shape: ", X_test.shape)# Create sequential model
cnn_model = tf.keras.models.Sequential()
#First CNN layer with 32 filters, conv window 3, relu activation and same padding
cnn_model.add(Conv1D(filters=32, kernel_size=(3,), padding='same', activation=tf.keras.layers.LeakyReLU(alpha=0.001), input_shape = (X_train.shape[1],1)))
#Second CNN layer with 64 filters, conv window 3, relu activation and same padding
cnn_model.add(Conv1D(filters=64, kernel_size=(3,), padding='same', activation=tf.keras.layers.LeakyReLU(alpha=0.001)))
#Third CNN layer with 128 filters, conv window 3, relu activation and same padding
cnn_model.add(Conv1D(filters=128, kernel_size=(3,), padding='same', activation=tf.keras.layers.LeakyReLU(alpha=0.001)))
#Fourth CNN layer with Max pooling
cnn_model.add(MaxPool1D(pool_size=(3,), strides=2, padding='same'))
cnn_model.add(Dropout(0.5))
#Flatten the output
cnn_model.add(Flatten())
#Add a dense layer with 256 neurons
cnn_model.add(Dense(units = 256, activation=tf.keras.layers.LeakyReLU(alpha=0.001)))
#Add a dense layer with 512 neurons
cnn_model.add(Dense(units = 512, activation=tf.keras.layers.LeakyReLU(alpha=0.001)))
#Softmax as last layer with five outputs
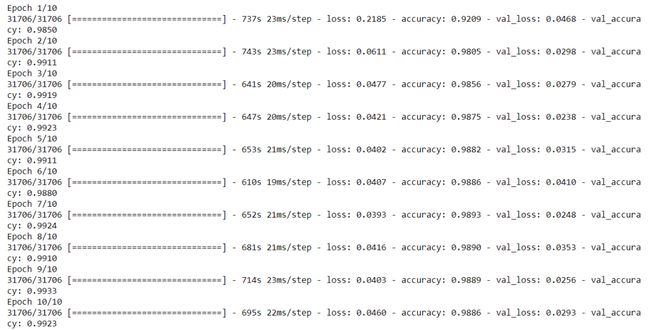
cnn_model.add(Dense(units = 5, activation='softmax'))cnn_model.compile(optimizer='adam', loss = 'sparse_categorical_crossentropy', metrics=['accuracy'])cnn_model.summary()cnn_model_history = cnn_model.fit(X_train, y_train, epochs=10, batch_size = 10, validation_data = (X_test, y_test))plt.plot(cnn_model_history.history['accuracy'])
plt.plot(cnn_model_history.history['val_accuracy'])
plt.legend(["accuracy","val_accuracy"])
plt.title('Accuracy Vs Val_Accuracy')
plt.xlabel('Epoch')
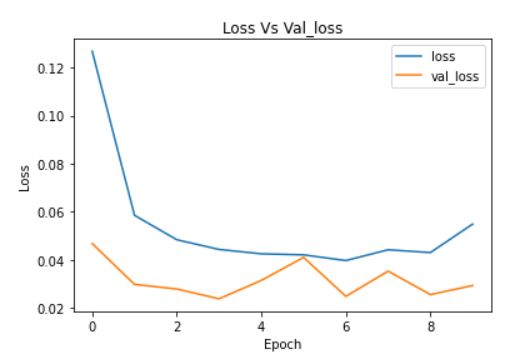
plt.ylabel('Accuracy')plt.plot(cnn_model_history.history['loss'])
plt.plot(cnn_model_history.history['val_loss'])
plt.legend(["loss","val_loss"])
plt.title('Loss Vs Val_loss')
plt.xlabel('Epoch')
plt.ylabel('Loss')完整代码:https://github.com/anandprems/mitbih_cnn
☆ END ☆
如果看到这里,说明你喜欢这篇文章,请转发、点赞。微信搜索「uncle_pn」,欢迎添加小编微信「 woshicver」,每日朋友圈更新一篇高质量博文。
↓扫描二维码添加小编↓


