图片的谱表征
用谱方法来表征图像 Spectral Representations of Natural Images
- 1.导入库
- 2.定义相关子函数
- 3.主函数
-
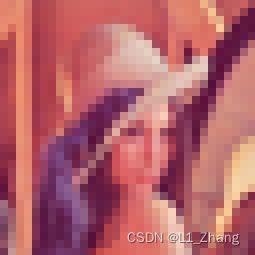
- 3.1 读入lenna图片、resize以及保存
- 3.2 计算该图像的拉普拉斯矩阵及谱特征
- 3.3 图像重建及保存
- 参考文献
本文是对Understanding Convolutions on Graphs以及对应的google colab:SpectralRepresentations.ipynb的学习总结。
通过学习此文,也可以深入理解下图神经网络中谱空间模型。
注意:该colab存在一两处bug,可参考本文fix过的代码。完整代码见https://download.csdn.net/download/WANGWUSHAN/86781716。
1.导入库
import functools
import itertools
import os
import matplotlib.pyplot as plt
import numpy as np
import scipy.sparse
import scipy.sparse.linalg
2.定义相关子函数
主要包括了计算图的拉普拉斯矩阵 L = D − A L=D-A L=D−A以及图的重建子函数。
def get_index(x, y, img_width, img_height):
    return y * img_width + x


def get_neighbours(x, y, img_width, img_height):
    neighbours_x_pos = [max(0, x - 1), x, min(x + 1, img_width - 1)]
    neighbours_y_pos = [max(0, y - 1), y, min(y + 1, img_height - 1)]
    neighbours = itertools.product(neighbours_x_pos, neighbours_y_pos)
    neighbours = set(neighbours)
    neighbours.discard((x, y))
    return neighbours


def compute_sparse_laplacian(img_width, img_height):
#计算图的拉普拉斯矩阵
    neighbours_fn = functools.partial(
        get_neighbours, img_width=img_width, img_height=img_height)
    index_fn = functools.partial(
        get_index, img_width=img_width, img_height=img_height)

    senders = []
    recievers = []
    values = []
    for x in range(img_width):
        for y in range(img_height):
            pos = (x, y)
            pos_index = index_fn(*pos)

            degree = 0.
            for neighbour in neighbours_fn(*pos):
                neigh_index = index_fn(*neighbour)
                senders.append(pos_index)
                recievers.append(neigh_index)
                values.append(-1.)
                degree += 1.

            senders.append(pos_index)
            recievers.append(pos_index)
            values.append(degree)
    return scipy.sparse.coo_matrix((values, (senders, recievers)))


def keep_first_components(img_data, num_components):
#图的重建子函数
    orig_shape = img_data.shape
    img_reshaped = np.reshape(img_data, (-1, 3))
    chosen_eigenvecs = eigenvecs[:, :num_components]
    spectral_coeffs = chosen_eigenvecs.T @ img_reshaped
    upd_img_data_reshaped = chosen_eigenvecs @ spectral_coeffs
    return np.reshape(upd_img_data_reshaped, orig_shape).astype(int)
3.主函数
3.1 读入lenna图片、resize以及保存
from PIL import Image
img_name = 'E:/lenna.png'
img_width = 32
img_height = 32
img_data = np.asarray(Image.open(img_name).resize((img_width, img_height)))
save_dir = 'E:/spectral_representation'
if not os.path.exists(save_dir):
    os.makedirs(save_dir)

plt.axis('off')
_ = plt.imshow(img_data)
plt.show()
Image.fromarray(img_data).save(os.path.join(save_dir, '1ena.png'))
3.2 计算该图像的拉普拉斯矩阵及谱特征
计算拉普拉斯矩阵,以及该矩阵的特征值、特征向量。
num_eigenvecs = 800
assert num_eigenvecs < img_width*img_height
v0 = np.ones(img_width * img_height)
laplacian = compute_sparse_laplacian(img_width, img_height)
eigenvals, eigenvecs = scipy.sparse.linalg.eigsh(
    laplacian, k=num_eigenvecs,  which='SM', v0=v0)
assert np.all(eigenvals >= 0)

plt.hist(eigenvals, bins=100)
plt.title('Histogram of Laplacian Eigenvalues')
plt.show()
3.3 图像重建及保存
base_name = os.path.basename(img_name).split('.')[0]

for num_components in [1, 10, 100, 200, 500, num_eigenvecs]:
    upd_img_data = keep_first_components(
        img_data, num_components).astype(np.uint8)
    upd_img_name = f'{base_name}-{num_components}.png'

    # plt.axis('off')
    # plt.imshow(upd_img_data)

    Image.fromarray(upd_img_data).save(
        os.path.join(save_dir, upd_img_name))
base_name = os.path.basename(img_name).split('.')[0]

for num_components in [1, 10, 100, 200, 500, img_width*img_height]:
    upd_img_data = keep_first_components(
        img_data, num_components).astype(np.uint8)
    upd_img_name = f'{base_name}-{num_components}.png'

    plt.axis('off')
    plt.imshow(upd_img_data)

    Image.fromarray(upd_img_data).save(
        os.path.join(save_dir, upd_img_name))
下图从左到右使用的特征向量个数分别为1, 10, 100, 200, 500, 800。可以看出随着特征向量增多,重建效果越来越好。

参考文献
[1] Understanding Convolutions on Graphs
[2] google colab:SpectralRepresentations.ipynb

