python案例——利用python画图
1、画直线
问题描述:
利用python中的 turtle (海龟绘图)模块提供的函数绘制直线
算法设计:
- turtle.penup(): 画笔抬起
- turtle.color(): 设置颜色
- turtle.goto(): 画笔移动到下一目标
- turtle.pendown(): 画笔落下
代码实现:
import turtle

turtle.penup()
turtle.color('green','red')
turtle.goto(100,100)
turtle.pendown()

turtle.goto(100,-100)
turtle.goto(-100,-100)
turtle.goto(-100,100)
turtle.goto(100,100)
turtle.goto(5,215)
turtle.goto(-108,90)

turtle.done()
效果展示:
2、画圆和圆弧
算法设计:
- turtle.width(): 设置宽度
- turtle.color("color"): 设置颜色
- turtle.circle(): 画圆第一个参数指定半径
- turtle.forward(len): 前进len指定的距离
- turtle.left(3): 左转3个单位
- turtle.done(): 关闭turtle
代码实现:
import turtle

turtle.width(2)
turtle.color("black")
turtle.circle(120)  #画圆
#画眼睛
turtle.penup()
turtle.goto(-60,130)
turtle.pendown()
turtle.color("black")
turtle.circle(20)

turtle.penup()
turtle.goto(60,130)
turtle.pendown()
turtle.color("black")
turtle.circle(20)

#画鼻子
turtle.penup()
turtle.goto(0,120)
turtle.pendown()
turtle.goto(-50,70)
turtle.goto(50,70)
turtle.goto(0,120)

#画嘴巴
turtle.penup()
turtle.goto(-60,45)
turtle.pendown()
turtle.setheading(90)   #设置朝向
len = 1
for j in range(60):
    if j>30:
        len +=0.2
    else:
        len -=0.2
    turtle.forward(len)
    turtle.left(3)
turtle.goto(-60,45)
turtle.done()
效果展示:
3、彩色图形
代码实现:
import turtle

t= turtle.Pen() #启用画笔
turtle.bgcolor("white") #设置画板背景颜色
sides=6     #图形边数
colors = ["red","yellow","green","blue","orange","purple"]  #颜色列表
for x in range(360):
    t.pencolor(colors[x%sides])
    t.forward(x*3/sides+x)  #前进也可以写成 x.forward(x)
    t.left(360/sides+1)     #左转60°
    t.width(x*sides/200)    #画笔宽度
效果展示:
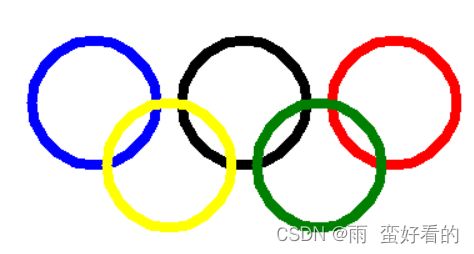
代码实现:
import turtle

def wuhuan():
    turtle.width(8)

    turtle.color("blue")
    turtle.circle(50)

    turtle.penup()
    turtle.goto(120,0)
    turtle.pendown()

    turtle.color("black")
    turtle.circle(50)

    turtle.penup()
    turtle.goto(240,0)
    turtle.pendown()

    turtle.color("red")
    turtle.circle(50)

    turtle.penup()
    turtle.goto(60,-50)
    turtle.pendown()

    turtle.color("yellow")
    turtle.circle(50)

    turtle.penup()
    turtle.goto(180,-50)
    turtle.pendown()

    turtle.color("green")
    turtle.circle(50)

    turtle.down()

wuhuan()
效果展示:
4、余弦曲线
算法设计:
用到 python 中的 NumPy 库,matplotlib 库
1)生成一个0-360°的数组
x = np.linspace(0,2*np.pi,100) #生成指定大小的一维数组
2)生成余弦值
y = np.cos(x)
3) 传入数据
plt.plot(x,y,linewidth = 4)
plt.plot(x,y,'g') #设置绿色
4)绘制曲线
plt.show()
代码实现:
import numpy as np
import matplotlib.pyplot as plt

plt.rcParams['font.sans-serif'] = ['SimHei']    #用于显示中文字符
plt.rcParams['axes.unicode_minus'] = False  #用来显示负号

x = np.linspace(0,2*np.pi,100)  #生成指定大小的一维数组
y = np.cos(x)
plt.plot(x,y,linewidth = 4)
plt.plot(x,y,'g')
plt.title("余弦图")
plt.show()
效果展示:
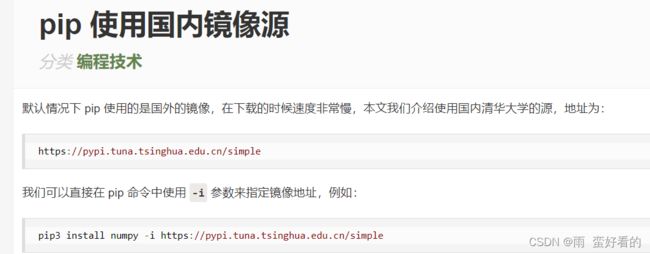
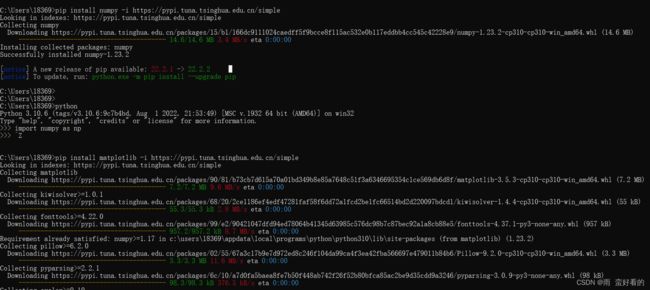
在使用numpy库和matplotlib库的时候报错:No module named 'numpy' No module named 'matplotlib',解决方法:使用pip源
加载numpy库和matplotlib库:
C:\Users\18369>pip install numpy -i https://pypi.tuna.tsinghua.edu.cn/simple
同样的道理安装matplotlib。
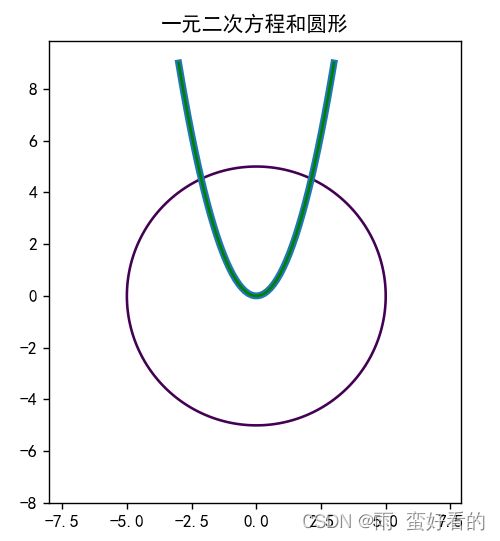
5、绘制空心圆
代码实现:
import numpy as np
import matplotlib.pyplot as plt

plt.rcParams['font.sans-serif'] = ['SimHei']    #用于显示中文字符
plt.rcParams['axes.unicode_minus'] = False  #用来显示负号

x = y = np.arange(-8,8,0.1)     #用于生成一维数组序列
x,y = np.meshgrid(x,y)
#绘制 x^2 + y^2 = 25
plt.contour(x,y,x**2+y**2,[25])

#一元二次方程
x1 = np.linspace(-3,3,50)
y1 = x1**2
plt.plot(x1,y1,linewidth=4)
plt.plot(x1,y1,'g')

plt.title("一元二次方程和圆形")
plt.axis('scaled')
plt.show()
效果展示:
6、绘制饼状图
代码实现:
import matplotlib.pyplot as plt

plt.rcParams['font.sans-serif'] = ['SimHei']    #用于显示中文字符
labels = '苹果','香蕉','雪梨','西瓜','葡萄'
sizes = [10,15,8,62,5]
explode = (0,0,0,0.1,0)     #分割出第二个分片
fig1,ax1 = plt.subplots()   #设置子图

ax1.pie(sizes,explode=explode,labels=labels,autopct='%1.1f%%',shadow=True,startangle=90)    #绘制饼状图
ax1.axis('equal')   #保证绘制出来的是圆形
plt.title('水果销售图')
plt.show()
效果展示:
7、散点图
代码实现:
import numpy as np
import matplotlib.pyplot as plt

#自定义生成y的函数
def cData(n):
    a1 = np.cos(2*np.pi*n)
    b1 = np.exp(-n)
    return a1*b1

plt.rcParams['font.sans-serif'] = ['SimHei']    #用于显示中文字符
plt.rcParams['axes.unicode_minus'] = False  #用来显示负号ax1.axis('equal')   #保证绘制出来的是圆形

d1 = np.arange(0.0,6.0,0.1)     #生成一维数组序列
point = plt.plot(d1,cData(d1),'ro')     #绘制
plt.setp(point,'markersize',5) #设置数据点的大小
plt.setp(point,'markerfacecolor','g') #设置数据点的大小
plt.title('散点图')
plt.show()
效果展示:


