ml是什么
The past few months must be not easy for millions of soccer fans including me. As a die-hard fan of Real Madrid, I have already watched the highlights of Ronaldo, Raúl over and over again, trying to fulfill the excitement brought my favorite side but taken by COVID-19. But the good news is, soccer is back: three weeks ago, UEFA announced that from quarter-finals, UEFA Champion League (UCL) will be back in early August, and all fixtures will be single-elimination and released all the fixture draws. It is a piece of good news for me because I have been thinking about how Real will make a comeback in Manchester for months and here is the time to witness.
对于包括我在内的数百万足球迷来说,过去几个月一定不容易。 作为皇马的忠实粉丝,我已经一遍又一遍地看过罗纳尔多,劳尔的精彩场面,试图通过激动来实现我最喜欢的一面,但被COVID-19接受了。 但是好消息是, 足球又回来了:三周前,欧洲足联宣布从八强赛开始,欧洲冠军联赛(UCL)将在八月初复出,所有固定装置将被淘汰,并释放所有固定装置的抽签 。 这对我来说是个好消息,因为几个月来我一直在思考皇马将如何在曼彻斯特卷土重来,现在是时候见证一下。
However, the question is, how much is the comeback possible?
但是,问题是,卷土重来的可能性有多大?
So in the last week, I with the question in mind started a machine learning project to research how the UCL matches will go on when they return. In this project, I researched who would be the potential champion in the end, who can be named “winning underdog”, and most importantly, how far Real Madrid might reach. In the rest of the article, I am going to show how I carried this project entirely from the start to the end all on my own, while sharing any interesting discoveries.
因此,在上周,我想到了一个问题,就开始了一个机器学习项目,以研究UCL比赛返回时如何进行比赛。 在这个项目中,我研究了最终谁将成为潜在的冠军,谁将被称为“失败者”,最重要的是,皇马可能走多远。 在本文的其余部分中,我将展示如何在分享所有有趣发现的同时,完全自始至终地独自承担这个项目。
数据采集 (Data Collection)
The data I needed is all the information that was generated during the games before the long suspension. Hence, I collected all the data of 2019/2020 UCL using Scrapy in fbref.com. This covered the qualification rounds, group stage, and several knockouts that had taken place in February and March.
我需要的数据是长时间停赛前在比赛期间产生的所有信息。 因此,我在fbref.com中使用Scrapy收集了2019/2020 UCL的所有数据。 这涵盖了资格赛,小组赛以及2月和3月发生的几次淘汰赛。
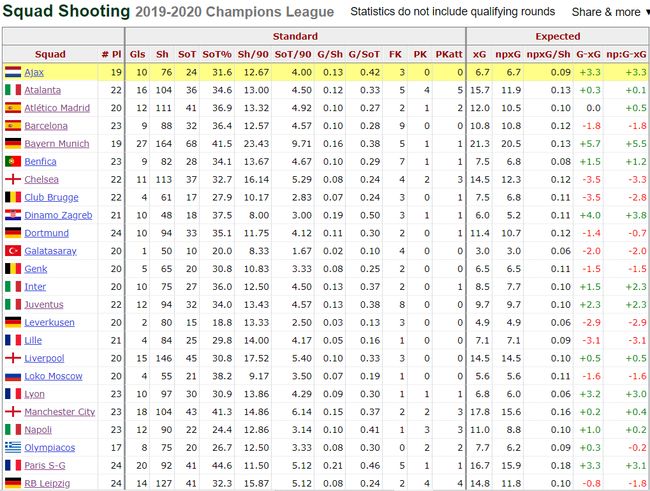
Screenshot of fixtures/results (source from the author) 夹具/结果的屏幕截图(作者提供)Generally speaking, the data is categorized into two kinds: the side names and their final scores in a match (shown in the caption above), and the detailed data about the squads which are separated in several aspects such as goalkeeping, shooting, possession, etc. To be honest, I had no idea at that time if all the data I collected would be in use, but I just kept them all to avoid web-scraping again. I would tell about how I decide what features are supposed to be used in the next section.
一般而言,数据分为两类:比赛中的边名和最终得分(如上标题所示),以及有关球队的详细数据,这些数据分为几个方面,例如守门员,射门,控球,坦白说,当时我不知道我收集的所有数据是否都将被使用,但我只是保留了所有数据以避免再次进行网络抓取。 我将告诉我如何决定下一部分应使用哪些功能。
Passing data (source from the author) 传递数据(作者提供) Shooting data (source from the author) 拍摄数据(作者提供)数据清理和预处理 (Data Cleaning & Pre-processing)
So my next step is to configure the pandas DataFrame using the collected data. As mentioned above, it wasn’t certain whether all the features of the dataset should be utilized. Some of them are just one property but described into aggregate form and average form. For example, Gls and Gls/90 respectively stand for goals in total and goals on average. Therefore, I just extracted the features that reflect the average performance of the squad and the following image illustrates what I kept:
所以我的下一步是使用收集的数据配置pandas DataFrame。 如上所述,不确定是否应利用数据集的所有特征。 其中一些只是一种属性,但以汇总形式和平均形式描述。 例如,Gls和Gls / 90分别代表总体目标和平均目标。 因此,我只提取了反映小队平均表现的特征,下图说明了我保留的内容:
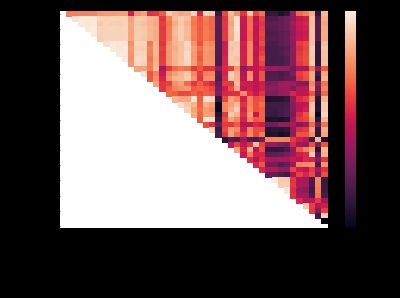
Remaining columns (source from the author) 剩余的列(作者提供的信息)Such kind of feature selection cannot 100% eliminate multilinearity though. Perhaps between some remaining features, they are highly interdependent with each other even if they have a different name. This can be unveiled by plotting the correlation heatmap among the features:
但是,这种特征选择不能100%消除多线性。 也许在其余的某些功能之间,即使它们的名称不同,它们之间也是高度相互依赖的。 可以通过在功能之间绘制相关热图来揭示这一点:
Heatmap of selected features (source from the author) 选定功能的热图(作者提供)Obviously, there exist some strong correlations. My solution to it is the dimensionality reduction by Prior Component Analysis. Before carrying out PCA, I needed to merge the fixture table with the feature set because I assumed the data of both sides of a match was the input of my model.
显然,存在一些强相关性。 我的解决方案是通过先验分量分析降低尺寸。 在执行PCA之前,我需要将夹具表与特征集合并,因为我认为匹配双方的数据都是我模型的输入。
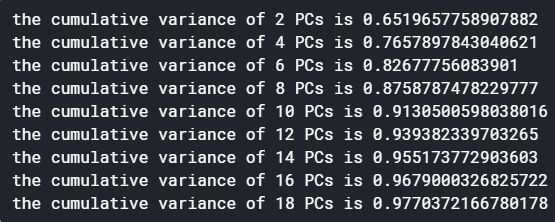
As for the number of prior components, I also carried out a little test and it turned out that the first 14 prior components are already able to explain more than 95% of the information. That is impressive given that previously we had more than 80 input variables in total.
至于先前组件的数量,我还进行了一些测试,结果发现前14个先前组件已经能够解释超过95%的信息。 考虑到以前我们总共有80多个输入变量,这令人印象深刻。
The cumulative variance of first prior components (source from the author) 第一个先验成分的累积方差(作者提供)造型 (Modeling)
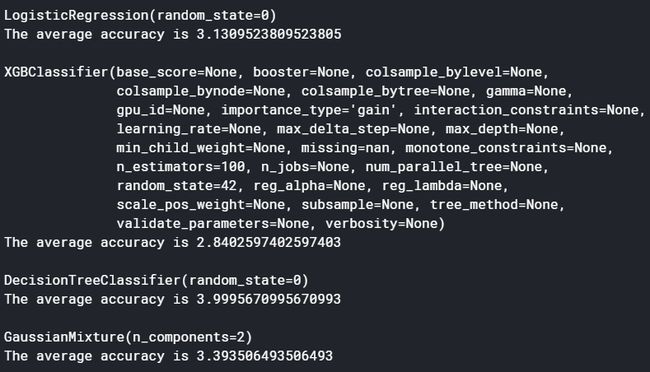
I chose four models for comparison: Logistics Regression, XGBoosting, Decision Tree, and Gaussian Mixture Model. I cross-validated them each in 5 folds, using Rooted Mean Square Error (RMSE) as the measure, and found that XGBoosting outperformed any other counterpart.
我选择了四个模型进行比较:后勤回归,XGBoosting,决策树和高斯混合模型。 我使用根均方根误差(RMSE)作为量度,对它们分别进行了5折交叉验证,发现XGBoosting的表现优于其他同类产品。
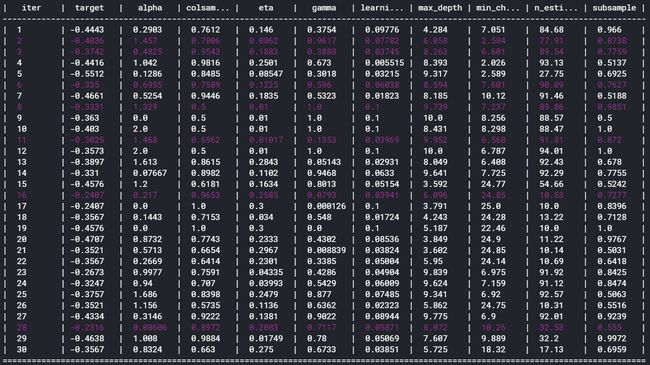
Comparison of the four models in terms of RMSE (source from the author) 四种模型在RMSE方面的比较(作者提供)And now I need to obtain the optimal prediction result. To do this, I tuned the parameters of the best performer XGBoosting using Bayesian Optimization.
现在,我需要获得最佳的预测结果。 为此,我使用贝叶斯优化优化了性能最佳的XGBoosting的参数。
Bayesian Optimization (source from the author) 贝叶斯优化(作者提供)The optimization increased the performance from about 2.84 to 2.74, and what is left now is to predict the results of future games.
优化使性能从大约2.84提高到2.74,现在剩下的就是预测未来游戏的结果。
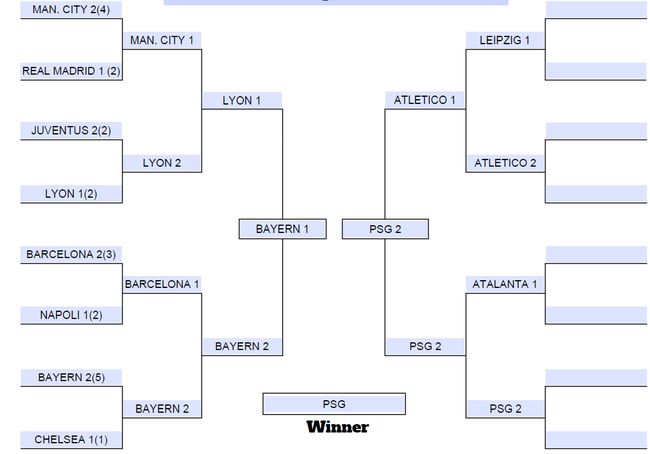
Fixture bracket (source from the author) 灯具支架(作者提供)In the above figure, the four teams on the right half have been through to the quarter-finals while the teams on the left still have the second leg to play this month. So the numbers in the brackets mean the aggregate scores of the sides in the round of 16, while the numbers outside of the brackets represent their scores in the second leg. Noteworthily, it is extremely weird that all the results of the remaining matches are Home 2: 1 Away, which would hardly happen in reality. It would not be an accurate prediction and there must be something that I missed and needs fixing.
在上图中,右半部分的四支球队进入了八强,而左半部分的球队本月仍有第二回合。 因此,括号中的数字表示第16轮中各边的总得分,而括号之外的数字表示第二回合中其得分。 值得注意的是,剩下的比赛的所有结果都是Home 2:1 Away ,这在现实中很难发生,这是非常奇怪的。 这将不是一个准确的预测,肯定有我想念的东西需要修复。
改善 (Improvement)
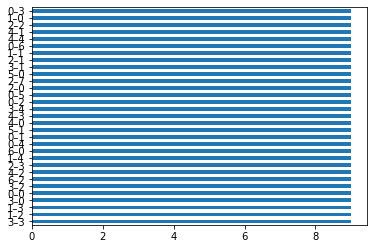
It took me a while to think through the entire process all over again and notice that the problem comes from the imbalance of data. Soccer is a type of sport that there will not be likely to have many goals in a match. In other words, a game with more goals less tends to happen frequently. According to my observation, regardless of home/away difference, 1:1, 2:1, 2:0 are the mostly seen scores on the result table in this season’s UCL up to now. That is to say, a team just score 2 goals at most in most of their games.
我花了一段时间才重新考虑整个过程,并注意到问题出在数据不平衡。 足球是一项运动,一场比赛中不可能有很多进球。 换句话说,具有更多目标的游戏往往会频繁发生。 根据我的观察,无论主场/客场差异如何,到目前为止,本赛季UCL比赛成绩表上最常看到的是1:1、2:1、2:0。 也就是说,一支球队在大多数比赛中最多只能进球2个进球。
Match result distribution (source from the author) 比赛结果分配(作者提供) Score distribution of one side in one game (source from the author) 一场比赛中一侧得分的分布(作者提供)However, there also exist some matches such as 4:4 and 7:2, though they just happened once. That makes my prediction biased because the model got cheated and tended to label a game with one of the most frequent samples.
但是,也存在一些匹配,例如4:4和7:2,尽管它们只发生一次。 这使我的预测有偏差,因为该模型被欺骗并倾向于用最频繁的样本之一来标记游戏。
There are two solutions to this issue: downsizing the dataset or over-sampling. Cutting off the dataset would also take away part of the information from the dataset, and considering the small scale of my dataset, this absolutely is not an ideal option. And then it just left me only one choice.
有两个解决方案:缩小数据集或过采样。 切断数据集还会从数据集中删除部分信息,并且考虑到我的数据集规模较小,这绝对不是理想的选择。 然后,这只给我留下了唯一的选择。
I tried the python package called “imlearn”, and because imlearn has not enabled over-sampling towards multi-label classification, my alternative is to apply RandomOverSampling to the Scores of one game (one column) instead of how many goals two sides scored (two columns). In this way, I viewed the result of each game as a label and equally populated each of them.
我尝试了名为“ imlearn ”的python程序包,由于imlearn尚未启用对多标签分类的过度采样,因此我的替代方法是将RandomOverSampling应用于一个游戏(一栏)的得分,而不是两边得分的进球数(两列)。 这样,我将每个游戏的结果视为一个标签,并平均填充每个游戏。
Match result distribution after over-sampling (source from the author) 过度采样后的匹配结果分布(作者提供)And now all I need to do is just repeat the following steps.
现在,我只需要重复以下步骤即可。
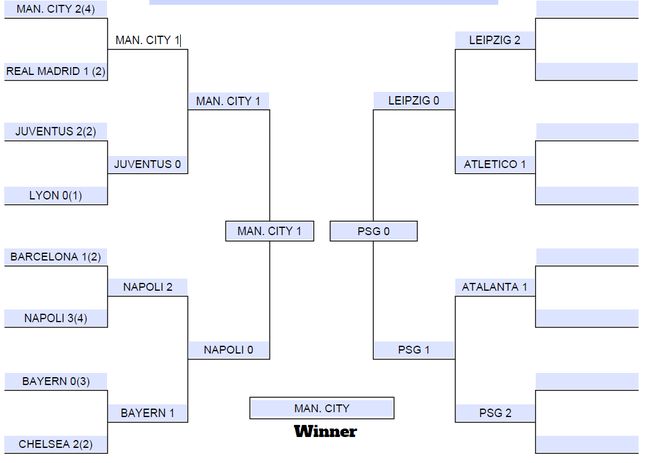
The results look good now! (source from the author) 结果看起来不错! (作者提供)One last factor that I need to control is the parameters of the classifying model. Based on my observation, the parameters tuned by Bayesian Optimization are not stable, which means that they might probably be different in different optimization and consequently so are the prediction generated by the model. To have a relatively reliable value, I simulated the tournament by running the entire prediction over 300 times to calculate how big the possibility of each side to win the trophy.
我需要控制的最后一个因素是分类模型的参数。 根据我的观察,贝叶斯优化调整的参数不稳定,这意味着它们在不同的优化中可能会有所不同,因此模型生成的预测也是如此。 为了获得相对可靠的价值,我通过对整个预测进行了300次模拟来模拟比赛,以计算双方赢得奖杯的可能性有多大。
And the result of the simulation above is illustrated as the following figure:
上面的仿真结果如下图所示:
Round-by-round probability based on XGBoosting 基于XGBoosting的逐轮概率结论 (Conclusion)
To sum up, now I can answer the questions that I had in mind when I started the project:
综上所述,现在我可以回答启动项目时想到的问题:
- Manchester City is the most dominating side that it has more than 50% of chance to win the trophy; Paris Saint-Germain ranks the second on the leader board, thanks to its relatively easy right half. 曼城是最主要的球队,它有超过50%的机会赢得冠军。 巴黎圣日耳曼俱乐部(Paris Saint-Germain)靠右后卫,因此在排行榜上排名第二。
- RB Leipzig would be the most probable underdog to be crowned. Moreover, don’t forget Napoli: they are estimated to have a 46% chance of getting through to the quarter-final stage, and 22% to the semi-final. So beware, Messi and Lewandowski! RB莱比锡将是最有可能被加冕的弱者。 此外,不要忘记那不勒斯:据估计,他们有46%的机会进入八强,而22%的机会进入半决赛。 所以要当心,梅西和勒万多夫斯基!
Though I’m not willing to accept it, I should admit that Real’s comeback in Manchester would like a Mission Impossible to the ML model: we just have a 0.33% chance to survive this round and literally no chance to go further.
尽管我不愿意接受,但我应该承认,皇马在曼彻斯特的复出希望进行ML模型无法完成的任务 :我们只有0.33%的机会能够幸存于这一回合,而实际上没有机会继续前进。
思想 (Thoughts)
It is a project that is carried entirely on my own when I had nothing else to kill my time, so I guess there must be something that I failed to take into better consideration. As far as I am concerned, there are 3 aspects that I should have done better in this project:
当我没有其他事情可以打发时间时,这是一个完全由我自己承担的项目,所以我想一定有一些我没有更好地考虑的事情。 就我而言,在这个项目中我应该在三个方面做得更好:
Timeliness of the data. If you read this article carefully enough, you must remember that what I use for prediction is solely the data of UCL of this season. Nevertheless, the thing is that the last match of UCL has already been approximately 5 months ago, and things would change over the 5 months. In other words, I didn’t take the most recent performance into account. Just take Real as an example. It is acknowledged that they underperformed in the group stage and the first leg versus Man. City. But since the restart of La Liga, they have not lost one single game (10 wins, 1 draw) and won the domestic champion. Given such a furious performance, are you still confident that Pep Guardiola’s side is going to eliminate Zizou’s without mercy?
数据的及时性 。 如果您足够仔细地阅读了本文,则必须记住,我用于预测的只是本赛季UCL的数据。 不过,事实是,UCL的最后一场比赛已经在大约5个月前了,情况会在5个月内发生变化。 换句话说,我没有考虑最新的表现。 仅以Real为例。 公认的是,他们在小组赛中表现不佳,并且在第一回合对曼的比赛中表现不佳。 市。 但是自从西甲联赛重新开始以来,他们并没有输过一场比赛(10胜1平)并赢得了国内冠军 。 鉴于如此疯狂的表现,您是否仍然相信瓜迪奥拉的一面会消灭齐祖的无情?
Draw breaker. When there appears a “draw” draw, say, two sides score the same goals in the single-elimination match, or, they score the same aggregate goals and the away goals in the double-elimination fixture, I have no idea to judge which side deserves to be through. All I did is to choose one between them randomly. From where I stand, collecting the data of the games which extended to the overtime and even penalty shootouts in previous reasons is the key to solve this problem.
抽断路器 。 例如,当出现“平局”平局时,双方在单淘汰赛中得分相同,或者在双重淘汰赛中得分相同,总进球和客场进球,我不知道该评哪个一面值得经历。 我要做的就是在它们之间随机选择一个。 从我的立场出发,收集以前原因导致的加班甚至点球大战的游戏数据是解决此问题的关键。
Individual players’ impact on the match. Throughout the project, I have just considered the macro performance of the teams but never thought of their players. Ignoring them might discredit the accuracy of the prediction model: some players have been transferred and no longer able to play for their previous sides. For instance, Timo Werner, such a dangerous striker who contributed to 6 goals (including assists) to the German side RB Leipzig, while the entire team just has 14 goals in total on record until now. So it is safe to say that his transfer to Chelsea would definitely go with the luxurious stats, and possibly RB Leipzig’s fire powers.
个人球员对比赛的影响 。 在整个项目中,我只是考虑了团队的宏观表现,却没有想到他们的球员。 忽略他们可能会破坏预测模型的准确性:一些球员已经被调任,不再能够为自己的前任效力。 例如,蒂莫·沃纳(Timo Werner)就是这样一个危险的前锋,他为德国方面的莱比锡RB贡献了6个进球(包括助攻),而迄今为止,整个团队总共只有14个进球。 因此,可以肯定地说, 他转会切尔西肯定会拥有豪华的数据,还有莱比锡RB的火力。
That’s all of my first ever data science project towards UCL champion prediction. What a fantastic experience! If you love reading story, please give me a clap and click the follow button, this is your biggest encouragement to me. And if you are interested in my implementation, feel free to visit my Kaggle kernel at https://www.kaggle.com/anzhemeng/19-20-ucl-champion-prediction.
这是我有史以来第一个针对UCL冠军预测的数据科学项目。 多么奇妙的经历! 如果您喜欢阅读故事,请给我鼓掌,然后单击“跟随”按钮,这是对我的最大鼓励。 如果您对我的实现感兴趣,请随时访问https://www.kaggle.com/anzhemeng/19-20-ucl-champion-prediction访问我的Kaggle内核。
And finally, ¡hala Madrid y nada más!
最后,“ Hala Madrid y nadamás”!
Photo by Manuel Nöbauer on Unsplash ManuelNöbauer在 Unsplash上的 照片翻译自: https://towardsdatascience.com/ml-ml-who-is-the-champion-of-them-all-1a4d253e86ad
ml是什么


