空间计量模型_截面数据空间计量模型空间滞后模型及Stata操作和应用
空间计量经济学创造性地处理了经典计量方法在面对空间数据时的缺陷,考察了数据在地理观测值之间的关联。近年来在人文社会科学空间转向的大背景下,空间计量已成为空间综合人文学和社会科学研究的基础理论与方法,尤其在区域经济、房地产、环境、人口、旅游、地理、政治等领域,空间计量成为开展定量研究的必备技能。
1横截面空间计量及Stata应用——空间滞后模型
空间滞后模型(Spatial Lag Model,SLM)主要是探讨各变量在一地区是否有扩散现象(溢出效应)。其模型表达式为:参数 反映了自变量对因变量的影响,空间滞后因变量 是一内生变量,反映了空间距离对区域行为的作用。区域行为受到文化环境及与空间距离有关的迁移成本的影响,具有很强的地域性(Anselin et al.,1996)。由于SLM模型与时间序列中自回归模型相类似,因此SLM也被称作空间自回归模型(Spatial Autoregressive Model,SAR)。
2命令安装及介绍
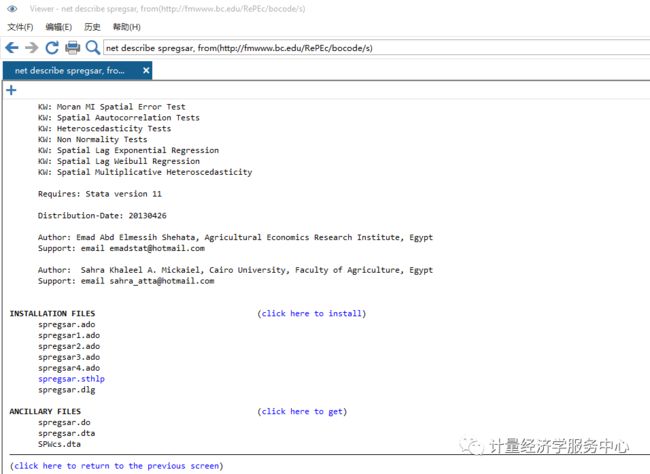
spregsar:最大似然估计空间滞后截面回归模型
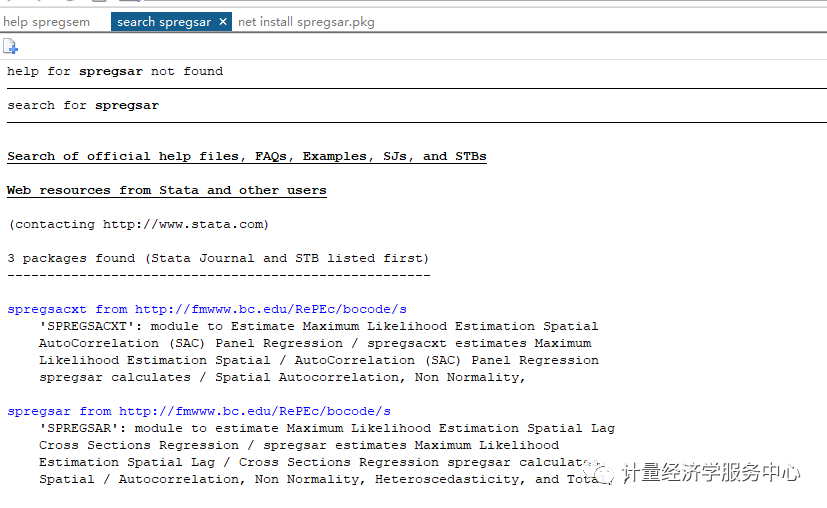
由于是一个外部命令,因此需要先安装下载。
help spregsar*或者findit spregsarssc install spregsar语法格式为:
spregsar depvar indepvars [weight] , wmfile(weight_file) [ lmspac lmhet lmnorm diag tests stand inv inv2 dist(norm|exp|weib) mfx(lin, log) mhet(varlist) predict(new_var) resid(new_var) iter(#) tech(name) ll(real 0) coll zero tolog nolog robust noconstant level(#) vce(vcetype) maximize other maximization options ]选项含义为:
depvar表示被解释变量
indepvars 表示解释变量
wmfile(weight_file) 表示导入权重矩阵
inv使用逆标准化权重矩阵(1/W)
inv2 使用反平方标准化权重矩阵(1/W^2)
zero将缺失值的观测值转换为0
coll 保持共线变量;默认移除共线变量
nolog不显示迭代次数
robust表示Huber-White标准误差
level,表示置信区间水平;默认是95%水平
3操作案例
操作案例1
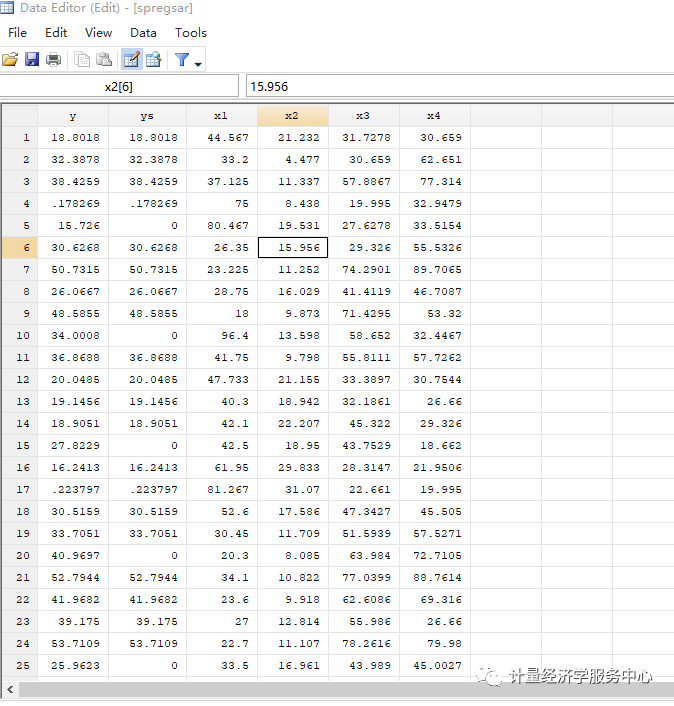
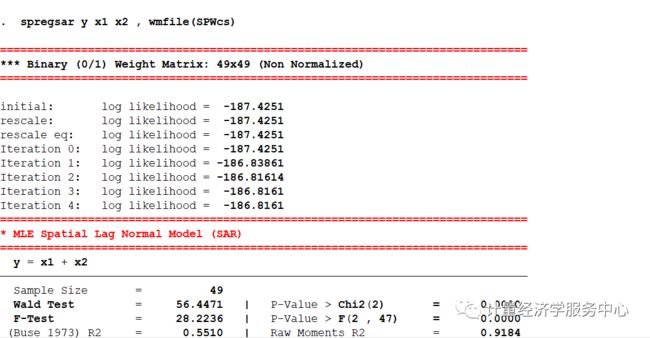
log using 计量经济学服务中心.log , replaceclear allsysuse spregsar.dta, clear* (1) MLE Spatial Lag Normal Regression Modelspregsar y x1 x2 , wmfile(SPWcs) test(2) MLE Spatial Lag Exponential Regression Modelspregsar y x1 x2 , wmfile(SPWcs) dist(exp) mfx(lin) test* (3) MLE Spatial Lag Weibull Regression Modelspregsar y x1 x2 , wmfile(SPWcs) dist(weib) mfx(lin) test* (4) MLE Weighted Spatial Lag Regression Modelspregsar y x1 x2 [weight = x1], wmfile(SPWcs) mfx(lin) testspregsar y x1 x2 [aweight = x1], wmfile(SPWcs) mfx(lin) test* (5) MLE Spatial Lag Tobit - Truncated Dependent Variable (ys)spregsar ys x1 x2 , wmfile(SPWcs) mfx(lin) test* (6) MLE Spatial Lag Multiplicative Heteroscedasticityspregsar y x1 x2 , wmfile(SPWcs) mfx(lin) test mhet(x2)结果为:
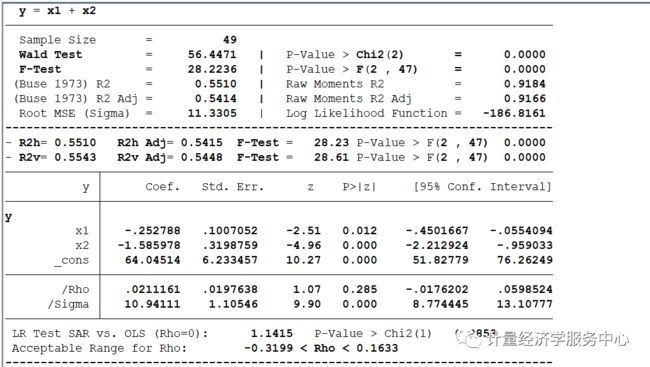
spregsar y x1 x2 , wmfile(SPWcs) mfx(lin) test==============================================================================*** Binary (0/1) Weight Matrix: 49x49 (Non Normalized)==============================================================================initial: log likelihood = -187.4251rescale: log likelihood = -187.4251rescale eq: log likelihood = -187.4251Iteration 0: log likelihood = -187.4251 Iteration 1: log likelihood = -186.83861 Iteration 2: log likelihood = -186.81614 Iteration 3: log likelihood = -186.8161 Iteration 4: log likelihood = -186.8161 ==============================================================================* MLE Spatial Lag Normal Model (SAR)============================================================================== y = x1 + x2------------------------------------------------------------------------------ Sample Size = 49 Wald Test = 56.4471 | P-Value > Chi2(2) = 0.0000 F-Test = 28.2236 | P-Value > F(2 , 47) = 0.0000 (Buse 1973) R2 = 0.5510 | Raw Moments R2 = 0.9184 (Buse 1973) R2 Adj = 0.5414 | Raw Moments R2 Adj = 0.9166 Root MSE (Sigma) = 11.3305 | Log Likelihood Function = -186.8161------------------------------------------------------------------------------- R2h= 0.5510 R2h Adj= 0.5415 F-Test = 28.23 P-Value > F(2 , 47) 0.0000- R2v= 0.5543 R2v Adj= 0.5448 F-Test = 28.61 P-Value > F(2 , 47) 0.0000------------------------------------------------------------------------------ y | Coef. Std. Err. z P>|z| [95% Conf. Interval]-------------+----------------------------------------------------------------y | x1 | -.252788 .1007052 -2.51 0.012 -.4501667 -.0554094 x2 | -1.585978 .3198759 -4.96 0.000 -2.212924 -.959033 _cons | 64.04514 6.233457 10.27 0.000 51.82779 76.26249-------------+---------------------------------------------------------------- /Rho | .0211161 .0197638 1.07 0.285 -.0176202 .0598524 /Sigma | 10.94111 1.10546 9.90 0.000 8.774445 13.10777------------------------------------------------------------------------------ LR Test SAR vs. OLS (Rho=0): 1.1415 P-Value > Chi2(1) 0.2853 Acceptable Range for Rho: -0.3199 < Rho < 0.1633------------------------------------------------------------------------------==============================================================================* Model Selection Diagnostic Criteria==============================================================================- Log Likelihood Function LLF = -186.8161---------------------------------------------------------------------------- Akaike Information Criterion (1974) AIC = 139.1818- Akaike Information Criterion (1973) Log AIC = 4.9358---------------------------------------------------------------------------- Schwarz Criterion (1978) SC = 156.2734- Schwarz Criterion (1978) Log SC = 5.0516---------------------------------------------------------------------------- Amemiya Prediction Criterion (1969) FPE = 136.2414- Hannan-Quinn Criterion (1979) HQ = 145.4344- Rice Criterion (1984) Rice = 140.3238- Shibata Criterion (1981) Shibata = 138.2198- Craven-Wahba Generalized Cross Validation (1979) GCV = 139.7269------------------------------------------------------------------------------==============================================================================*** Spatial Aautocorrelation Tests============================================================================== Ho: Error has No Spatial AutoCorrelation Ha: Error has Spatial AutoCorrelation- GLOBAL Moran MI = 0.1476 P-Value > Z( 1.984) 0.0472- GLOBAL Geary GC = 0.7581 P-Value > Z(-1.861) 0.0627- GLOBAL Getis-Ords GO = -0.7111 P-Value > Z(-1.980) 0.0476------------------------------------------------------------------------------- Moran MI Error Test = 0.6624 P-Value > Z(8.047) 0.5077------------------------------------------------------------------------------- LM Error (Burridge) = 2.3900 P-Value > Chi2(1) 0.1221- LM Error (Robust) = 2.9300 P-Value > Chi2(1) 0.0869------------------------------------------------------------------------------ Ho: Spatial Lagged Dependent Variable has No Spatial AutoCorrelation Ha: Spatial Lagged Dependent Variable has Spatial AutoCorrelation- LM Lag (Anselin) = 0.0097 P-Value > Chi2(1) 0.9215- LM Lag (Robust) = 0.5497 P-Value > Chi2(1) 0.4585------------------------------------------------------------------------------ Ho: No General Spatial AutoCorrelation Ha: General Spatial AutoCorrelation- LM SAC (LMErr+LMLag_R) = 2.9397 P-Value > Chi2(2) 0.2300- LM SAC (LMLag+LMErr_R) = 2.9397 P-Value > Chi2(2) 0.2300------------------------------------------------------------------------------==============================================================================* Heteroscedasticity Tests============================================================================== Ho: Homoscedasticity - Ha: Heteroscedasticity------------------------------------------------------------------------------- Hall-Pagan LM Test: E2 = Yh = 0.9799 P-Value > Chi2(1) 0.3222- Hall-Pagan LM Test: E2 = Yh2 = 0.5735 P-Value > Chi2(1) 0.4489- Hall-Pagan LM Test: E2 = LYh2 = 1.1041 P-Value > Chi2(1) 0.2934------------------------------------------------------------------------------- Harvey LM Test: LogE2 = X = 2.7678 P-Value > Chi2(2) 0.2506- Wald LM Test: LogE2 = X = 6.8293 P-Value > Chi2(1) 0.0090- Glejser LM Test: |E| = X = 7.1015 P-Value > Chi2(2) 0.0287------------------------------------------------------------------------------- Machado-Santos-Silva Test: Ev=Yh Yh2 = 2.8060 P-Value > Chi2(2) 0.2459- Machado-Santos-Silva Test: Ev=X = 7.0429 P-Value > Chi2(2) 0.0296------------------------------------------------------------------------------- White Test -Koenker(R2): E2 = X = 7.1879 P-Value > Chi2(2) 0.0275- White Test -B-P-G (SSR): E2 = X = 9.9225 P-Value > Chi2(2) 0.0070------------------------------------------------------------------------------- White Test -Koenker(R2): E2 = X X2 = 7.5497 P-Value > Chi2(4) 0.1095- White Test -B-P-G (SSR): E2 = X X2 = 10.4218 P-Value > Chi2(4) 0.0339------------------------------------------------------------------------------- White Test -Koenker(R2): E2 = X X2 XX= 18.7572 P-Value > Chi2(5) 0.0021- White Test -B-P-G (SSR): E2 = X X2 XX= 25.8930 P-Value > Chi2(5) 0.0001------------------------------------------------------------------------------- Cook-Weisberg LM Test E2/Sig2 = Yh = 1.3527 P-Value > Chi2(1) 0.2448- Cook-Weisberg LM Test E2/Sig2 = X = 9.9225 P-Value > Chi2(2) 0.0070------------------------------------------------------------------------------*** Single Variable Tests (E2/Sig2):- Cook-Weisberg LM Test: x1 = 0.8877 P-Value > Chi2(1) 0.3461- Cook-Weisberg LM Test: x2 = 4.5468 P-Value > Chi2(1) 0.0330------------------------------------------------------------------------------*** Single Variable Tests:- King LM Test: x1 = 0.0468 P-Value > Chi2(1) 0.8287- King LM Test: x2 = 4.7943 P-Value > Chi2(1) 0.0286------------------------------------------------------------------------------==============================================================================* Non Normality Tests============================================================================== Ho: Normality - Ha: Non Normality------------------------------------------------------------------------------*** Non Normality Tests:- Jarque-Bera LM Test = 1.6737 P-Value > Chi2(2) 0.4331- White IM Test = 5.4242 P-Value > Chi2(2) 0.0664- Doornik-Hansen LM Test = 3.8663 P-Value > Chi2(2) 0.1447- Geary LM Test = -3.3066 P-Value > Chi2(2) 0.1914- Anderson-Darling Z Test = 0.3147 P > Z( 0.181) 0.5716- D'Agostino-Pearson LM Test = 2.5887 P-Value > Chi2(2) 0.2741------------------------------------------------------------------------------*** Skewness Tests:- Srivastava LM Skewness Test = 0.4911 P-Value > Chi2(1) 0.4835- Small LM Skewness Test = 0.6007 P-Value > Chi2(1) 0.4383- Skewness Z Test = -0.7750 P-Value > Chi2(1) 0.4383------------------------------------------------------------------------------*** Kurtosis Tests:- Srivastava Z Kurtosis Test = 1.0875 P-Value > Z(0,1) 0.2768- Small LM Kurtosis Test = 1.9880 P-Value > Chi2(1) 0.1585- Kurtosis Z Test = 1.4100 P-Value > Chi2(1) 0.1585------------------------------------------------------------------------------ Skewness Coefficient = -0.2452 - Standard Deviation = 0.3398 Kurtosis Coefficient = 3.7611 - Standard Deviation = 0.6681------------------------------------------------------------------------------ Runs Test: (14) Runs - (23) Positives - (26) Negatives Standard Deviation Runs Sig(k) = 3.4501 , Mean Runs E(k) = 25.4082 95% Conf. Interval [E(k)+/- 1.96* Sig(k)] = (18.6460 , 32.1703 )------------------------------------------------------------------------------==============================================================================*** Tobit Heteroscedasticity LM Tests============================================================================== Separate LM Tests - Ho: Homoscedasticity- LM Test: x1 = 0.8065 P-Value > Chi2(1) 0.3692- LM Test: x2 = 8.2353 P-Value > Chi2(1) 0.0041 Joint LM Test - Ho: Homoscedasticity - LM Test = 8.2933 P-Value > Chi2(2) 0.0158==============================================================================*** Tobit Non Normality LM Tests============================================================================== LM Test - Ho: No Skewness - LM Test = 0.4723 P-Value > Chi2(1) 0.4919 LM test - Ho: No Kurtosis - LM Test = 2.5256 P-Value > Chi2(1) 0.1120 LM Test - Ho: Normality (No Kurtosis, No Skewness) - Pagan-Vella LM Test = 2.5809 P-Value > Chi2(2) 0.2751 - Chesher-Irish LM Test = 48.9962 P-Value > Chi2(2) 0.0000------------------------------------------------------------------------------* Beta, Total, Direct, and InDirect (Model= ): Linear: Marginal Effect *+-------------------------------------------------------------------------------+| Variable | Beta(B) | Total | Direct | InDirect | Mean ||--------------+------------+------------+------------+------------+------------||y | | | | | || x1 | -0.2528 | -0.2522 | -0.2266 | -0.0256 | 38.4362 || x2 | -1.5860 | -1.5824 | -1.4218 | -0.1606 | 14.3749 |+-------------------------------------------------------------------------------+* Beta, Total, Direct, and InDirect (Model= ): Linear: Elasticity *+-------------------------------------------------------------------------------+| Variable | Beta(Es) | Total | Direct | InDirect | Mean ||--------------+------------+------------+------------+------------+------------|| x1 | -0.2766 | -0.2760 | -0.2480 | -0.0280 | 38.4362 || x2 | -0.6490 | -0.6475 | -0.5818 | -0.0657 | 14.3749 |+-------------------------------------------------------------------------------+ Mean of Dependent Variable = 35.1288操作案例
操作案例2
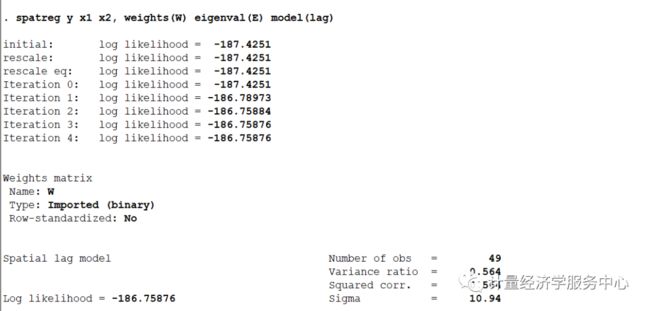
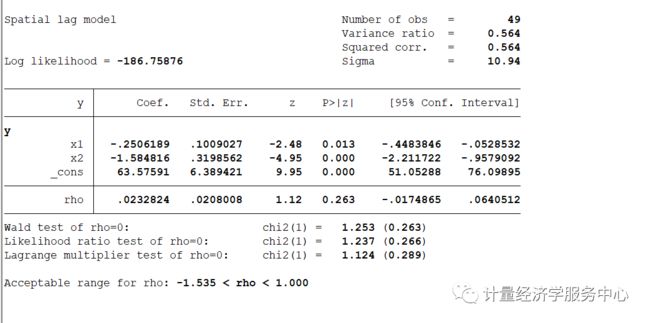
下面使用上述数据,但是使用spatreg命令进行操作,并对相关结果进行对比
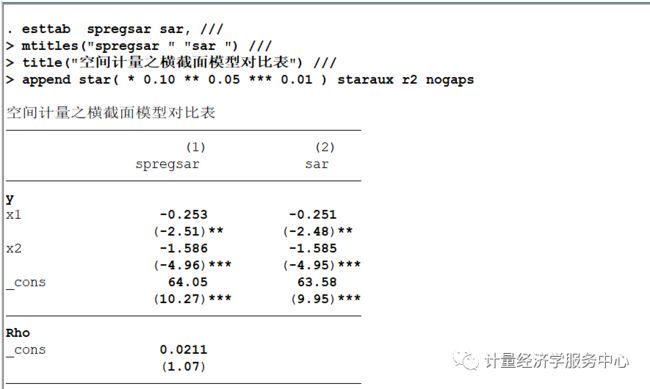
结果对比
可以发现上述结果基本一致
