【空气质量数据分析专题十】不同区域空气质量对比分析
前言
分析单个地区只能反映该区域的空气质量状况,不同地区对比分析可以得到整个大区域内空气质量的相对优劣状况。这里的区域对比分析一般为一个行政区域内的更低一级的行政区域之间的对比分析。本节以贵州省安顺市为例进行分析。
分析流程
对数据进行专题二的预处理后,计算出各区域各指标的均值,最后进行可视化分析。
核心代码
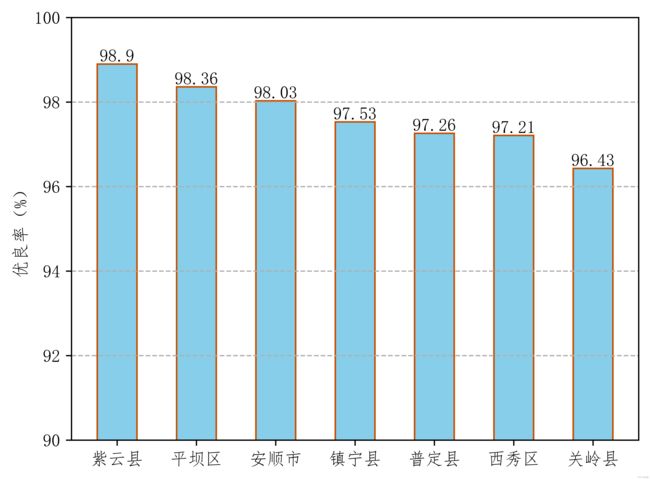
(1)优良率对比分析
def special_e_g_analysis():
       """
       特定优良率分析
       :return:
       """
       all_county = {'安顺市': 98.03,
                     '关岭县': 96.43,
                     '平坝区': 98.36,
                     '普定县': 97.26,
                     '西秀区': 97.21,
                     '镇宁县': 97.53,
                     '紫云县': 98.9}
       all_county_sorted = sorted(all_county.items(), key=lambda x: x[1], reverse=True)
       e_g_rate = [x[1] for x in all_county_sorted]
       county = [y[0] for y in all_county_sorted]
       colors = ['#95d0fc', '#d1b26f', '#c7fdb5', '#cea2fd', '#c1f80a', '#c65102', '#d5b60a']

       plt.figure()
       plt.bar(range(len(e_g_rate)), width=0.5, height=e_g_rate, color='skyblue', edgecolor='#c65102')
       plt.xticks(range(len(e_g_rate)), county)
       plt.ylim(90, 100)
       plt.grid(axis='y', ls='--')
       plt.ylabel('优良率(%)')

       for a, b in zip(np.arange(len(e_g_rate)), e_g_rate):
           plt.text(a, b, str(b), ha='center', va='bottom')

       plt.show()
(2)超标状况对比分析
def special_over_standard_analysis(self):
      """
      特定超标状况分析
      :return: None
      """
      all_county = {'安顺市': [0, 4, 3],
                    '关岭县': [1, 6, 6],
                    '平坝区': [1, 3, 2],
                    '普定县': [1, 7, 2],
                    '西秀区': [1, 5, 4],
                    '镇宁县': [2, 7, 0],
                    '紫云县': [0, 1, 3]}
      all_county_sorted = sorted(all_county.items(), key=lambda x: sum(x[1]), reverse=True)
      county = [y[0] for y in all_county_sorted]
      pm10 = [y[1][0] for y in all_county_sorted]
      pm2_5 = [y[1][1] for y in all_county_sorted]
      o3 = [y[1][2] for y in all_county_sorted]
      total = [sum(y[1]) for y in all_county_sorted]
      sec_bottom = [(x + y) for x, y in zip(pm10, pm2_5)]

      ind = range(len(county))

      width = 0.5  # 设置条形图一个长条的宽度
      p1 = plt.bar(ind, pm10, width, color='#a57e52', edgecolor='#c65102')
      p2 = plt.bar(ind, pm2_5, width, bottom=pm10, color='#fac205', edgecolor='#c65102')
      p3 = plt.bar(ind, o3, width, bottom=sec_bottom, color='#76cd26', edgecolor='#c65102')

      plt.legend((p1[0], p2[0], p3[0]), ('PM$_{10}$', 'PM$_{2.5}$', 'O$_{3}$'))
      plt.xticks(ind, county)
      plt.ylim(0, 14)
      plt.grid(axis='y', ls='--')
      plt.ylabel('超标天数(天)及首要污染物')

      for a, b in zip(np.arange(len(county)), total):
          plt.text(a, b, str(b), ha='center', va='bottom')

      plt.show()
(3)浓度对比分析,可分析多指标值
def special_concentration_analysis(self):
     """
     特定浓度分析
     :return:
     """
     data = [48.97098976,
             48.89279333,
             45.80278552,
             43.9280615,
             43.47455752,
             43.08954394,
             42.42865075
             ]
     data = [round(x, 3) for x in data]

     county = ['安顺市',
               '西秀区',
               '普定县',
               '镇宁县',
               '平坝区',
               '关岭县',
               '紫云县']
     plt.figure()
     plt.bar(range(len(data)), width=0.5, height=data, color='#65fe08', edgecolor='#c65102')
     plt.xticks(range(len(data)), county)
     # plt.ylim(90, 100)
     plt.grid(axis='y', ls='--')
     # plt.ylabel('污染物浓度(${μg}$/m${^3}$)')
     plt.ylabel('AQI')

     for a, b in zip(np.arange(len(data)), data):
         plt.text(a, b, str(b), ha='center', va='bottom')

     plt.show()
结果展示与分析
(1)优良率对比结果
(图片右键新标签页打开会很清晰)
(2)超标情况对比结果
(图片右键新标签页打开会很清晰)
(3)浓度对比分析结果图(这里为臭氧日最大八小时滑动平均浓度)
(图片右键新标签页打开会很清晰)
结语
本专题分析内容较为基础,但比较实用,后续在工作学习中如有新的该方面的东西会整理更新,目前告一段落。
以下是本人独自运营的微信公众号,用于分享个人学习及工作生活趣事,大佬们可以关注一波。


