python:curve_fit()实现任意形式的曲线拟合
本函数不仅可以用于直线、二次曲线、三次曲线的拟合和绘制,仿照代码中的形式,可以适用于任意形式的曲线的拟合和绘制,只要定义好合适的曲线方程即可。
特点⬇ xdata可以是数组,就是可以实现多元回归
xdata:array_like or object
The independent variable where the data is measured. Should usually be an M-length sequence or an (k,M)-shaped array for functions with k predictors, but can actually be any object.
应用例子:
下面是从1月开始阿拉斯加每个月的温度极值(摄氏度):
最大值:17, 19, 21, 28, 33, 38, 37, 37, 31, 23, 19, 18
最小值:-62, -59, -56, -46, -32, -18, -9, -13, -25, -46, -52, -58
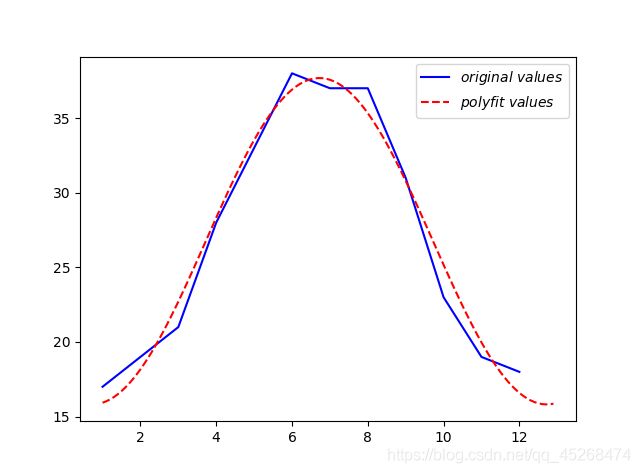
用scipy.optimize.curve_fit()拟合这个函数与数据
分析:
可以看出温度是以周期为12的正弦函数(这里一开始被我当成365了结果咋也做不好。。。)
构建函数
f ( x ) = a ⋅ s i n ( 2 π ⋅ x 12 + b ) + c f(x)=a\cdot sin(\frac{2\pi \cdot x}{12}+b )+c f(x)=a⋅sin(122π⋅x+b)+c
代码如下(模板,fund里代什么函数都可以,然后改xdata和ydata(这俩是拟合对象,模板里是先生成完全对应的y再加上随机数把它搞乱),有几个参数就对应倒第四行y2里的popt参数个数):
from scipy.optimize import curve_fit
import matplotlib.pyplot as plt
import numpy as np

def fund(x,a,b,c):
    return a*np.sin(2*np.pi/12*x+b)+c

x=np.arange(1, 13)
x2=np.arange(1,13,0.1)
y=[17,19, 21, 28, 33, 38, 37, 37, 31, 23, 19, 18]
fig,ax=plt.subplots()
popt, pcov=curve_fit(fund, x, y)
#popt数组中,三个值分别是待求参数a,b,c
ax.plot(x,y,'b-')
ax.legend(r'$original\ values$')
y2 = [fund(xx,popt[0],popt[1],popt[2]) for xx in x2]
ax.plot(x2,y2,'r--')
ax.legend(r'$polyfit\ values$')
print (popt)
plt.show()

