基于GA_BP神经网络的光伏出力预测
主程序:
p=day(1:59913,1:3)';
t=day(1:59913,4)';

[pn,ps]=mapminmax(p);
[tn,ts]=mapminmax(t);

input_test=day(59914:59956,1:3)';
output_test=day(59914:59956,4)';

inputn_test=mapminmax('apply',input_test,ps);


net=newff(minmax(pn),[S1,1],{'tansig','purelin'},'trainlm');

net.trainParam.show=10;
net.trainParam.epochs=150;
net.trainParam.goal=0.00001;
net.trainParam.lr=0.6;

[net,tr]=train(net,pn,tn);

s_bp=sim(net,inputn_test);

BPoutput=mapminmax('reverse',s_bp,ts);

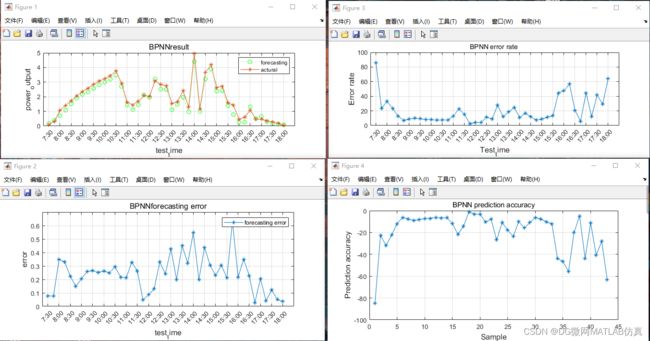
figure(1)
plot(BPoutput,':og');
hold on
plot(output_test,'-*');
legend('forecasting','actural')
title('BPNNresult','fontsize',12)
ylabel('power_output','fontsize',12)
xlabel('test_time','fontsize',12)
set(gcf,'color','white');
set(gca,'color','none');
set(gca,'XTick',[1 3 5 7 9 11 13 15 17 19 21 23 25 27 29 31 33 35 37 39 41 43])
set(gca,'XTickLabel',{'7:30','8:00','8:30','9:00','9:30','10:00','10:30','11:00','11:30','12:00','12:30','13:00','13:30','14:00','14:30','15:00','15:30','16:00','16:30','17:00','17:30','18:00'})
grid
hold off

%%BP(Estimate the absolute value error)
error=abs(BPoutput-output_test);
figure(2)
plot(error,'-*')
legend('forecasting error')
title('BPNNforecasting error','fontsize',12)
ylabel('error','fontsize',12)
xlabel('test_time','fontsize',12)
set(gcf,'color','white');
set(gca,'color','none');
set(gca,'XTick',[1 3 5 7 9 11 13 15 17 19 21 23 25 27 29 31 33 35 37 39 41 43])
set(gca,'XTickLabel',{'7:30','8:00','8:30','9:00','9:30','10:00','10:30','11:00','11:30','12:00','12:30','13:00','13:30','14:00','14:30','15:00','15:30','16:00','16:30','17:00','17:30','18:00'})
grid
hold off

figure(3)
plot((error./output_test)*100,'-*');
title('BPNN error rate ')
ylabel('Error rate','fontsize',12)
xlabel('Test_time','fontsize',12)
set(gcf,'color','white');
set(gca,'color','none');
set(gca,'XTick',[1 3 5 7 9 11 13 15 17 19 21 23 25 27 29 31 33 35 37 39 41 43])
set(gca,'XTickLabel',{'7:30','8:00','8:30','9:00','9:30','10:00','10:30','11:00','11:30','12:00','12:30','13:00','13:30','14:00','14:30','15:00','15:30','16:00','16:30','17:00','17:30','18:00'})
grid
hold off

figure(4)
plot(1-(error./output_test)*100,'-*');
title('BPNN prediction accuracy')
ylabel('Prediction accuracy','fontsize',12)
xlabel('Sample','fontsize',12)
set(gcf,'color','white');
grid
hold off

R=3;%the number of input node
S2=1;
S=R*S1+S1*S2+S1+S2;%length
bound=ones(S,1)*[-1,1];
sizepop=36;
initPop=initializega(sizepop,bound,'gabpEval');
gen=100;


net=train(net,pn,tn);
s_ga=sim(net,inputn_test);
gaoutput=mapminmax('reverse',s_ga,ts);

%GA-BPNNforecasing output
figure(6)
plot(gaoutput,':og')
hold on
plot(output_test,'-*');
hold on
plot(BPoutput,'--r+');
legend('GA-BPprediction','actual','BPprediction')
title('GA-BPNNprediction','fontsize',12)
ylabel('prediction','fontsize',12)
xlabel('sample','fontsize',12)
set(gcf,'color','white');
set(gca,'color','none');
set(gca,'XTick',[1 3 5 7 9 11 13 15 17 19 21 23 25 27 29 31 33 35 37 39 41 43])
set(gca,'XTickLabel',{'7:30','8:00','8:30','9:00','9:30','10:00','10:30','11:00','11:30','12:00','12:30','13:00','13:30','14:00','14:30','15:00','15:30','16:00','16:30','17:00','17:30','18:00'})
grid
hold off

error1=abs(gaoutput-output_test);

figure(7)
plot(error1,'-*');
hold on
plot(error,':og');
legend('GA-BPNNabsolute error','BPNNabsolute error')
title('compare absolute error','fontsize',12)
ylabel('absolute error','fontsize',12)
xlabel('sample','fontsize',12)
set(gcf,'color','white');
set(gca,'color','none');
set(gca,'XTick',[1 3 5 7 9 11 13 15 17 19 21 23 25 27 29 31 33 35 37 39 41 43])
set(gca,'XTickLabel',{'7:30','8:00','8:30','9:00','9:30','10:00','10:30','11:00','11:30','12:00','12:30','13:00','13:30','14:00','14:30','15:00','15:30','16:00','16:30','17:00','17:30','18:00'})
grid
hold off

figure(8)
plot((error1./output_test)*100,'-*');
hold on
plot((error./output_test)*100,':og');
title('GA-BPNN error rate ')
ylabel('Error rate','fontsize',12)
xlabel('Test_time','fontsize',12)
set(gcf,'color','white');
set(gca,'color','none');
set(gca,'XTick',[1 3 5 7 9 11 13 15 17 19 21 23 25 27 29 31 33 35 37 39 41 43])
set(gca,'XTickLabel',{'7:30','8:00','8:30','9:00','9:30','10:00','10:30','11:00','11:30','12:00','12:30','13:00','13:30','14:00','14:30','15:00','15:30','16:00','16:30','17:00','17:30','18:00'})
grid
hold off

figure(9)
plot((1-(error1./output_test))*100,'-*');
hold on
plot(1-(error./output_test)*100,':og');
title('GA-BPNNPrediction accuracy')
ylabel('Prediction accuracy','fontsize',12)
xlabel('样本','fontsize',12)
set(gcf,'color','white');
set(gca,'color','none');
set(gca,'XTick',[1 3 5 7 9 11 13 15 17 19 21 23 25 27 29 31 33 35 37 39 41 43])
set(gca,'XTickLabel',{'7:30','8:00','8:30','9:00','9:30','10:00','10:30','11:00','11:30','12:00','12:30','13:00','13:30','14:00','14:30','15:00','15:30','16:00','16:30','17:00','17:30','18:00'})
grid
结果图:
完整代码:基于GA-BP神经网络的光伏出力预测-电子商务文档类资源-CSDN文库
