集成学习之随机森林
集成学习
集成学习的思想是将若干个学习器(分类器&回归器)组合之后产生一个新学习器。弱分类器(weaklearner)指那些分类准确率只稍微好于随机猜测的分类器(errorrate < 0.5)
- 集成算法的成功在于保证弱分类器的多样性(Diversity)。而且集成不稳定的算法也能够得到一个比较明显的性能提升
- 常见的集成学习思想有:
• Bagging
• Boosting
• Stacking
学习方式
种类
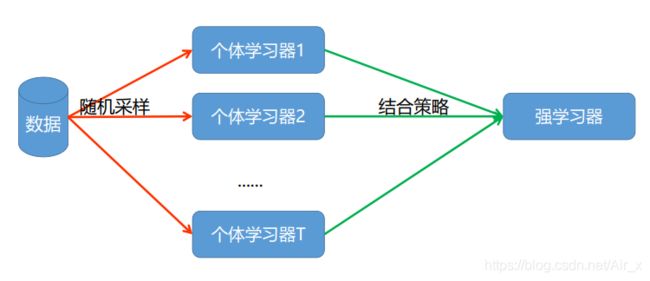
- Bagging方法又叫做自举汇聚法(Bootstrap Aggregating),思想是:在原始数据集上通过有放回的抽样的方式,重新选择出S个新数据集来分别训练S个分类器的集成技术。也就是说这些模型的训
练数据中允许存在重复数据。
• Bagging方法训练出来的模型在预测新样本分类的时候,会使用多数投票或者求均值的方式来统计最终的分类结果。
• Bagging方法的弱学习器可以是基本的算法模型,eg: Linear、Ridge、Lasso、Logistic、Softmax、ID3、C4.5、CART、SVM、KNN等。
• Bagging方式是有放回的抽样,并且每个子集的样本数量必须和原始样本数量一致,但是子集中允许存在重复数据。
结构
思想
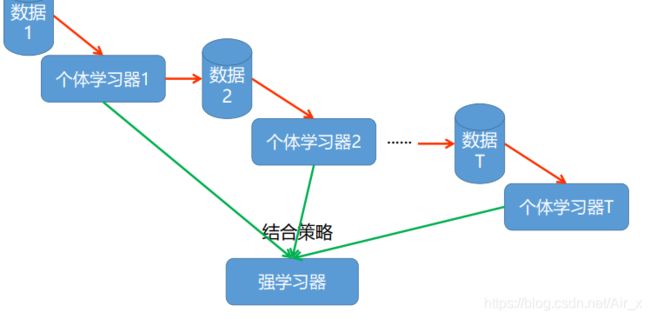
- Boosting思想:个体学习器之间存在强依赖关系,一系列个体学习器基本都需要串行生成,然后使用组合策略,得到最终的集成模型,这就是boosting的思想
- Bagging思想( Bootstrap AGGregatING )拔靴:个体学习器之间不存在强依赖关系,一系列个体学习器可以并行生成,然后使用组合策略,得到最终的集成模型。
处理方式
- 先构建:如何得到若干个个体学习器、弱学习器、基础学习器、基学习器
• 同质的 使用同一种类型弱学习器
• 异质的 使用不同种类的弱学习器 - 后结合:如何选择一种结合策略,将这些个体学习器集合成一个强学习器
• 回归
• Boosting:直接叠加、正则后叠加、学习法(Stacking)
• Bagging :平均法、带权平均法、学习法
• 分类
• Boosting :直接叠加、正则后叠加、学习法
• Bagging :投票法、带权投票法、学习法
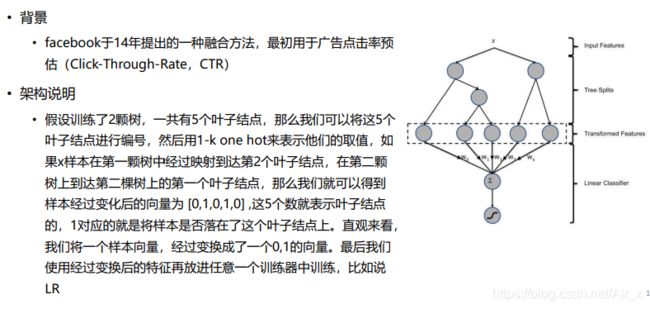
Stacking
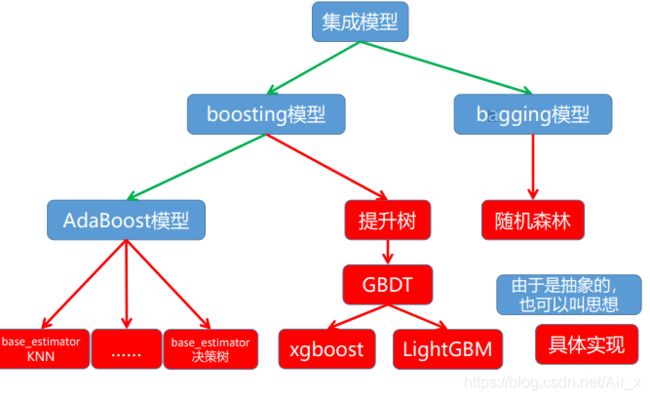
模型一览
随机森林
Bagging是Bootstrap Aggregating的缩写,通过并行地构造多个个体分类器,然后以一定的方式将它们组合成一个强学习器。
- 思想:RF是基于决策树的集成模型,随机森林是机器学习中最成功的算法之一,他能做二分类、多分类和回归任务。随机森林里集成了很多棵决策树,目的是减小过拟合的风险(减小模型方差)。
- 优点:
• 像决策树一样,RF可以处理类别特征与连续特征,能扩展到多类分类,不需要特征缩放,能捕获非线性关系和特征间的影响
• 算法可以并行
解释
- 森林:树的集合
- 随机:
• 样本随机:训练每一个决策树使用的都是bootstrapping(拔靴法)产生的数据集
• 特征随机:在每一个树结点上进行结点划分时,考虑特征子空间。简单做法:从原始特征中随机不重复地抽取一些特征;延伸做法:从原始特征中随机不重复地抽取一些特征,然后将某些特征线性合并,产生一系列组合特征。
结合策略
- 分类
• 投票:少数服从多数。每个树的预测结果就是给某个类别投一票,最终随机森林的输出值就是得票最多的类别 - 回归
• 平均法:每一个树都会输出一个实数,随机森林的输出值就是所有决策树输出值的均值
底层python实现
分类
import pandas as pd
import numpy as np
from sklearn.tree import DecisionTreeClassifier
from sklearn.metrics import f1_score

df = pd.DataFrame([
    [0,1],
    [1,1],
    [2,1],
    [3,-1],
    [4,-1],
    [5,-1],
    [6,1],
    [7,1],
    [8,1],
    [9,-1]
])
M = [] #存储决策树模型的数组
n_trees = 10  #设置树的颗数
for i in range(n_trees):
    tmp = df.sample(frac=0.8)  #对样本进行采样,目的是建造不同的树
    X = tmp.iloc[:,:-1]  #构造X
    Y = tmp.iloc[:,-1:]  #构造Y
    model = DecisionTreeClassifier(max_depth=2).fit(X, Y)
    M.append(model)  #将决策树模型加入数组
X = df.iloc[:,:-1] #获取全部数据的X
Y = df.iloc[:,-1:]#获取全部数据的Y
res = np.zeros(df.shape[0]) #初始化全零向量
for j, i in enumerate(M): #遍历模型数组
    y_ = i.predict(X)
    res += y_ #将每个模型预测值叠加到res变量
    print(j, f1_score(Y, y_))
print('---最终结果---')
y_ = np.sign(res) #取平均输出最终对每个样本标签的预测值
print(f1_score(Y, y_))
回归
import pandas as pd
import numpy as np
from sklearn.tree import DecisionTreeRegressor
from sklearn.metrics import mean_squared_error
import matplotlib.pyplot as plt

df = pd.DataFrame([
    [1,5.56],
    [2,5.7],
    [3,5.91],
    [4,6.4],
    [5,6.8],
    [6,7.05],
    [7,8.9],
    [8,8.7],
    [9,9],
    [10,9.05]
])
'''创建20个决策树,使用0.9的样本进行拟合,达到弱学习效果
并使用列表将20个弱学习进行存储,准备后续使用
'''
M = [] #存储决策树模型(弱分类器)的列表
n_trees = 20  #创建20棵分类树(弱分类器)
for i in range(n_trees):
    tmp = df.sample(frac=0.9)  #对样本进行采样,目的是建造不同的树
    X = tmp.iloc[:,[0]]  #构造采样后不同的x
    Y = tmp.iloc[:,[-1]]  #构造采用后不同的y
    model = DecisionTreeRegressor(max_depth=2).fit(X,Y)#创建的模型都是弱分类器
    M.append(model)
'''
使用全部的数据,使用每个弱分类器进行结果预测,并将每个弱分类器结果进行存储 打印每个弱分类器性能,查看弱分类器性能
'''
X = df.iloc[:,[0]] #获取全部数据的X
Y = df.iloc[:,-1] #获取全部数据的Y
res = np.zeros(df.shape[0]) #初始化全零向量
for j,i in enumerate(M): #遍历模型数组
    res += i.predict(X) #将每个模型预测值叠加到res变量
    y_ = i.predict(X)#打印模型预测值
    mse = mean_squared_error(Y, y_)
    print('第%d个模型的均方误差为%.2f'%(j, mse))#基学习器的均方误差

#将每次若分类器的结果除以弱分类器个数,得到最后的预测结果
y_ = res/n_trees #取平均输出最终对每个样本标签的预测值
print(mean_squared_error(Y, y_))

plt.rcParams['font.sans-serif'] = ['SimHei']
m = df.shape[0]
plt.plot(np.arange(m), Y, 'r-',  label='真实值')
plt.plot(np.arange(m), y_, 'b-', label='预测值')
plt.legend()
plt.grid()
plt.show()
随机森林特征选择
- 优点
• 高效:更简单的分割平面、更短的训练预测时间
• 泛化能力增强:无用特征被移除
• 可解释性增强 - 缺点
• 计算代价
• 如果没有选好 特征的话,会影响模型精度
置换检验
- 计算出每个特征的重要性,即 importance(k)。就能将不重要的特征舍弃,达到降维的效果
置换检验是统计学中显著性检测的一种。
- 思想:如果特征k是重要的,那么用随机的值将该特征破坏,重新训练和评估,计算模型泛化能力的退化程度,即 i m p o r t a n c e ( k ) = p e r f o r m a n c e ( G ) − p e r f o r m a n c e ( G ′ ) importance(k) = performance(G) - performance(G') importance(k)=performance(G)−performance(G′)这个退化程度就可以度量特征k的重要性。
OOB
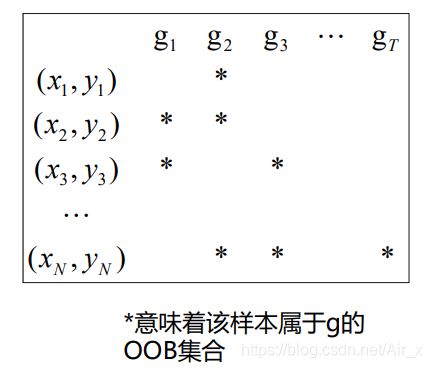
置换检验存在效率问题,需要重新训练与验证,耗时耗力。因此可使用 OOB 集合对模型进行验证。
在训练集中,存在没有用来训练的 g t g_{t} gt样本称为 g t g_{t} gt的 OOB 集合中的样本。如图所示,假设 x i x_i xi同时属于 g t g_{t} gt的 OOB 集合,将这些 g t g_{t} gt组合成一个 G G G,是 G G G中的部分值,记为 G i − G_{i}^{-} Gi−,那么 G G G的误差近似表示为:
E oab ( G ) = 1 N ∑ i = 1 N err ( y i , G i − ( x i ) ) E_{\text {oab }}(G)=\frac{1}{N} \sum_{i=1}^{N} \operatorname{err}\left(y_{i}, G_{i}^{-}\left(x_{i}\right)\right) Eoab (G)=N1i=1∑Nerr(yi,Gi−(xi))
就可透过OOB误差进行模型选择RF 参数
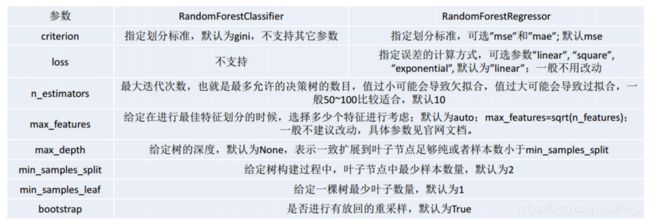
随机森林API
python实现
分类
import numpy as np
import pandas as pd
import matplotlib.pyplot as plt
import matplotlib as mpl
from sklearn.tree import DecisionTreeClassifier
from sklearn.ensemble import RandomForestClassifier
from sklearn.model_selection import train_test_split, GridSearchCV
from sklearn.preprocessing import StandardScaler, LabelEncoder
from sklearn.pipeline import Pipeline
import warnings
from sklearn.metrics import classification_report
warnings.filterwarnings('ignore')

data = pd.read_csv(r'../datas/iris.txt', header=None, names=['x1', 'x2', 'x3', 'x4', 'lable'])
x = data.iloc[:, :-1]
y = data.iloc[:, -1:]
lable = LabelEncoder()
y = lable.fit_transform(y)
x_train, x_test, y_train, y_test = train_test_split(x, y, test_size=0.3)
model = DecisionTreeClassifier()
dt = GridSearchCV(model, param_grid={'max_depth': [2, 3, 4, 5, 6]})
dt.fit(x_train, y_train)
print(dt.best_params_)
#随机森林分类
model = RandomForestClassifier()
param_grid = {'max_depth': [1, 2, 3], 'n_estimators':[10, 20, 30]}
rf = GridSearchCV(model, param_grid=param_grid, cv=3)
rf.fit(x_train, y_train)
print(rf.best_params_)
print(rf.score(x_test, y_test))
print(classification_report(y_test, rf.predict(x_test)))
回归
import pandas as pd
import numpy as np
import matplotlib.pyplot as plt
from sklearn.tree import DecisionTreeRegressor
from sklearn.ensemble import RandomForestRegressor
from sklearn.metrics import mean_squared_error, r2_score
from sklearn.model_selection import train_test_split, GridSearchCV
import warnings
warnings.filterwarnings('ignore')

data = pd.read_csv(r'../datas/Advertising.csv')
#划分x,y
x = data.iloc[:, :-1]
y = data.iloc[:, -1:]
#留出法,分训练集和测试集
x_train, x_test, y_train, y_test = train_test_split(x, y, test_size=0.3)
#创建决策树模型
model = DecisionTreeRegressor()
#网格搜索
param_grid={'max_depth':[3, 5, 7, 9, 11]}
tree = GridSearchCV(model, param_grid=param_grid, cv=3)
tree.fit(x_train, y_train)
print(tree.best_params_)
tree_score = tree.score(x_test, y_test)#R^2
print(tree_score)
tree_predict = tree.predict(x_test)#用于我们后续画图使用
#随机森林回归
model = RandomForestRegressor()
param_grid = {'max_depth': [1, 2, 3], 'n_estimators':[10, 20, 30]}
rf = GridSearchCV(model, param_grid=param_grid, cv=3)
rf.fit(x_train, y_train)
print(rf.best_params_)
rf_score = rf.score(x_test, y_test)
print(rf_score)
rf_predict = rf.predict(x_test)

plt.rcParams['font.sans-serif']=['SimHei']
m, n = y_test.shape#获取行和列
# print(m)
plt.plot(np.arange(m), y_test, 'r-', label='真实分布')
plt.plot(tree_predict, 'g-', label=u'决策树回归,$R^2$=%.4f' % tree_score)
plt.plot(rf_predict, 'b-', label=u'随机森林, $R^2$=%.4f'% rf_score)
plt.grid()
plt.legend()
plt.show()
