keras实现回归预测
机器学习小白一枚 目前在做机器学习和光学的交叉 希望各位大佬多多指正
背景:通过光纤结构的5个不同参数实现对其纯净度的预测
直接上图
我最终的目标是要实现通过图中 k n L r λ 这5个参数 实现对每个模式的purity Aeff dispersion 以及keer这四个参数的预测 那么这篇文章只做一个简单的对其中purity参数的预测 具体最终的多维度预测我会在接下来的文章中更新...
进入代码
首先就是对数据集的一个读取 然后创建两个数组分别承载他们
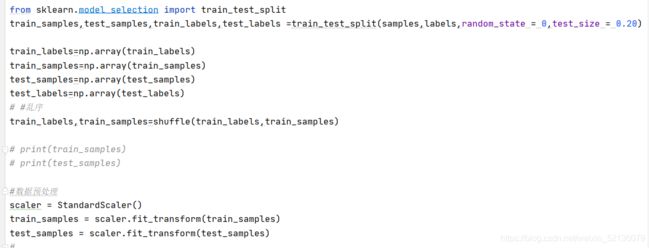
这个代码就是给他转化成一个np数组然后进行一个预处理 数据分割那块根据自己的数据集自行决定 像我最后的数据集的话可能直接分成了两个文件 就不需要在代码内给他们分割
一个简单的网络架构 这里他的输入维度是隐式包含在第一个Dense层里 我得输入维度有5个就设置为5 第一个全连接层也设置为5 然后再搭一个Dense和一个output (这块可以根据你自己的需要去调整 因为对于回归预测来说的话可能并不需要太复杂的结构 当然如果你想提高一下模型的拟合能力和泛化效果的话可以加深网络层数 但也不是越多越好 要根据你自己的网络结构去调试)
下面compile函数就是进行一个拟合 这里选用Adam优化 学习率设置为0.0001 损失函数用mse 评价函数用mae(对于mse 和 mae 这两个函数可以自行抉择 因为看了好多回归的网络基本上用的都是这两个 甚至有的根本不需要评价函数 直接上损失就够了)
自后fit函数 batchsize和epochs次数也是根据自己决定 bitchsize根据自己电脑计算能力 可以尽可能调小 validation_split是一个动态分配训练集 比如我设置的是0.2 就是动态分配20%的训练数据作为测试 主要目的是为了更直观的防止一个过拟合问题的出现 verbose就是迭代过程中的详细程度 主要有0 1 2 根据自己需求设置
预测部分代码 和最开始对训练数据的处理差不多
最后是完整代码
import os

import xlrd
import xlwt
import numpy as np
from random import randint
from sklearn.utils import shuffle
from sklearn.preprocessing import MinMaxScaler, StandardScaler
import tensorflow as tf
from tensorflow import keras
from tensorflow.keras.models import Sequential
from tensorflow.keras.layers import Activation,Dense
from tensorflow.keras.optimizers import Adam
from tensorflow.keras.metrics import categorical_crossentropy
import matplotlib.pyplot as plt

# data = xlrd.open_workbook('puity.xlsx')
# sheet = data.sheet_by_index(0)
#row1 = sheet.row_values(1)       #行
#col1 = sheet.col_values(3)        #列
#cell = sheet.cell(1,1).value

import tensorflow as tf
print("Num GPUS Available:",len(tf.config.experimental.list_physical_devices('GPUs')))
os.environ["CUDA_VISIBLE_DEVICES"]="0"

data = xlrd.open_workbook('puity_train.xlsx')
sheet = data.sheet_by_index(0)
nrows = sheet.nrows   #行数
ncols = sheet.ncols   #列数

samples = []    #训练样本
labels = []     #对应标签

for i in range(nrows):
    row = sheet.row_values(i)
    samples.append(row[0:5])
    labels.append(row[12])

from sklearn.model_selection import train_test_split
train_samples,test_samples,train_labels,test_labels =train_test_split(samples,labels,random_state = 0,test_size = 0.20)

train_labels=np.array(train_labels)
train_samples=np.array(train_samples)
test_samples=np.array(test_samples)
test_labels=np.array(test_labels)
# #乱序
train_labels,train_samples=shuffle(train_labels,train_samples)

# print(train_samples)
# print(test_samples)

#数据预处理
scaler = StandardScaler()
train_samples = scaler.fit_transform(train_samples)
test_samples = scaler.fit_transform(test_samples)
#
# print(train_samples)
# # print(train_labels)
# print(test_samples)
# # print(test_labels)


#
# scaler = MinMaxScaler(feature_range=(0,1))
# scaled_train_samples = scaler.fit_transform(np.array(train_samples).reshape(-1,1))

model = Sequential([
     Dense(units=5,input_shape=(5,),activation='relu'),
     Dense(units=32,activation='relu'),
     Dense(units=1)
 ])
# # #可视化网络模型
model.summary()
#
model.compile(optimizer=Adam(learning_rate=0.0001),loss='mse', metrics='mae')

# #
# # # 参数 validation_split=0.2   动态分配20%的训练集作为测试  防止出现过拟合问题
history = model.fit(x=train_samples,y=train_labels,validation_split=0.2,batch_size=64,epochs=2000,shuffle=True,verbose=2)
# mae = history.history['mae']
# val_mae = history.history['val_mae']
# loss = history.history['loss']
# val_loss = history.history['val_loss']
# epochs = range(1, len(loss) + 1)
# # acc = history.history['acc']  # 获取训练集准确性数据
# # val_acc = history.history['val_acc']  # 获取验证集准确性数据
# loss = history.history['loss']  # 获取训练集错误值数据
# val_loss = history.history['val_loss']  # 获取验证集错误值数据
# epochs = range(1, len(loss) + 1)
#
# plt.figure()  # 创建一个新的图表
# plt.plot(epochs, loss, 'bo', label='Trainning loss')
# plt.plot(epochs, val_loss, 'b', label='Vaildation loss')
# plt.legend()  ##绘制图例,即标明图中的线段代表何种含义
#
# plt.show()  # 显示所有图表
mae = history.history['mae']
val_mae = history.history['val_mae']
loss = history.history['loss']
val_loss = history.history['val_loss']
epochs = range(1, len(loss) + 1)
plt.figure()  # 创建一个新的图表
plt.plot(epochs, loss,  label='Trainning loss mse',color="blue",linewidth=0.3,linestyle='-.')
plt.plot(epochs, val_loss,  label='Vaildation loss mse',color="blue",linewidth=0.3,linestyle='--')
#预测

test_labels,test_samples = shuffle(test_labels,test_samples)
print(test_samples)
print(test_labels)
predictions = model.predict(x=test_samples,batch_size=32,verbose=0)
for i in predictions:
    print(i)

x = np.linspace(0,1000,800)
y1 = test_labels
y2 = predictions
plt.figure()
plt.plot(x,y1,label='test labels')
plt.plot(x,y2,label='predict labels',color="red",linewidth=1.0,linestyle='--')
plt.show()


