step5 lasso 回归 实战 本文没有考虑y 是cox和binominal
数据准备 x y
x=t(log2(exprSet+1))
x[1:5,1:3]
y=phe$event
head(phe)[,1:3]
head(y)
y
建立lasso模型
**
因为因变量是二分类,所以必须指定binomial ,1 表示lasso回归,指定运行50个lammada值,但是如果在运行完50个值之前,模型不在有提高,则会自动停下来
**
使用glmnet函数拟合模型 ,所谓的拟合模型其实就是一个获得方程参数的过程
这个产生的model_lasso对象里面包含了不同参数组合的模型,后面我们需要根据情况选择合适的参数来确定模型
**
model_lasso <- glmnet(x, y, family="binomial", nlambda=50, alpha=1)
print(model_lasso)
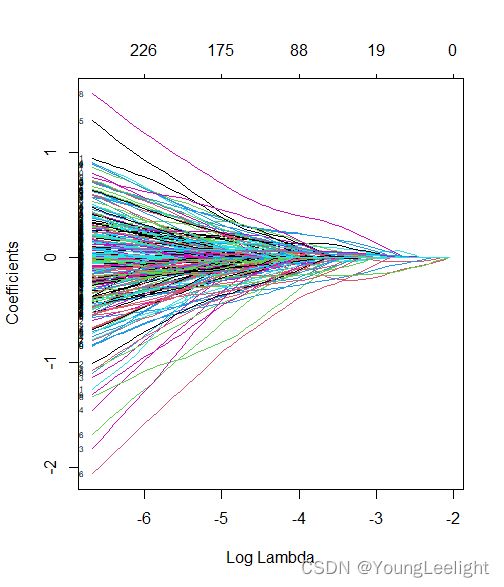
plot(model_lasso,xvar="lambda",label=T)
#每条线代表一个参数(变量),当lambda变大时候,不为零的参数越来越少,可以通过这种方式选择变量
数值输出法
查看model_lasso内容 不同的lammada值会产生不同的自由度和 可解释偏差
> print(model_lasso)

Call:  glmnet(x = x, y = y, family = "binomial", alpha = 1, nlambda = 50)

    Df  %Dev   Lambda
1    0  0.00 0.127800
2    3  1.36 0.116300
3    3  2.63 0.105900
4    4  3.87 0.096400
5    4  4.98 0.087750
6    6  6.51 0.079880
7    7  7.99 0.072720
8   10  9.62 0.066190
9   14 11.41 0.060260
10  16 13.18 0.054850
11  18 14.77 0.049930
12  19 16.34 0.045450
13  20 17.73 0.041370
14  29 19.40 0.037660
15  33 21.17 0.034280
16  37 22.89 0.031210
17  41 24.73 0.028410
18  52 26.90 0.025860
19  60 29.31 0.023540
20  67 31.78 0.021430
21  75 34.38 0.019510
22  88 37.11 0.017760
23  99 40.18 0.016160
24 102 43.09 0.014710
25 112 45.98 0.013390
26 118 48.75 0.012190
27 126 51.44 0.011100
28 139 54.19 0.010100
29 146 56.87 0.009198
30 157 59.48 0.008372
31 168 62.18 0.007621
32 171 64.87 0.006938
33 175 67.40 0.006315
34 184 69.80 0.005749
35 190 72.11 0.005233
36 197 74.29 0.004764
37 207 76.34 0.004337
38 215 78.33 0.003948
39 218 80.24 0.003593
40 216 81.98 0.003271
41 221 83.58 0.002978
42 225 85.04 0.002711
43 226 86.40 0.002467
44 227 87.61 0.002246
45 234 88.73 0.002045
46 232 89.76 0.001861
47 237 90.69 0.001694
48 239 91.53 0.001542
49 241 92.30 0.001404
50 244 92.99 0.001278
图形展示法
**画出β系数的变化图形
plot(model_lasso,xvar="lambda",label=T)
#每条线代表一个参数(变量),当lambda变大时候,,可以通过这种方式选择变量**

plot(model_lasso)
数值展示法中
****列%Dev代表了由模型解释的残差的比例,对于线性模型来说就是模型拟合的R^2(R-squred)。
它在0和1之间,越接近1说明模型的表现越好,
如果是0,说明模型的预测结果还不如直接把因变量的均值作为预测值来的有效。 #这里结果说明此模型并不好****
我们可以在序列范围内的一个或多个λ处获得模型系数,这里指定lambda为0.1时,可以查看到β系数
可以赋予s一个数值向量,同时查看多个lammada值所产生的β系数:
coef (fit, s = 0.1) 查看lammada值为0.1时,模型所产生的β系数
查看多个lammada值所产生的β系数
#这两行代码本质含义相同,所以输出相同
head(coef(model_lasso,s=model_lasso$lambda))[1:6,1:5]
head(model_lasso$beta)[1:6,1:6] #这两行代码本质含义相同,所以输出相同
**
根据数值展示 其实就已经可以确定lammada的数值 从上面那个表,可以看出取第29个lammda值 时,可解释偏差的变化就不大了,所以确定lammda的值为0.009198 ,再与0.009相比较
**
head(coef(model_lasso, s=c(model_lasso$lambda[29],0.009)))
plot_glmnet(model_lasso, xvar = "norm", label = TRUE) #应该是plot_glmnet而不是plot.glmnet
plot(model_lasso, xvar="lambda", label=TRUE)
s1列表示lammda取值为0.009198,模型所预测的β系数 这里看到有的基因没有β值,就表示它对模型的贡献很小,可以省略。 这些基因可以被过滤掉。这也就是我们常说的使用lasso回归来进行特征选择。利用lasoo回归把β系数值非常小的基因去掉。进而得到特征基因,可以利用这些特征基因进行cox多因素回归分析。
此时我们可以在指定的lammada值处,预测新变量所对应的y值 下图中s1列表示,lammada取0.001404和 0.001278 时,模型所预测的y值
dim(x)
head(x)[,1:3]
nx<-matrix(rnorm(5 * 552), 5, 552)
predict(model_lasso, newx = nx, s = c(0.001404, 0.001278))

那么得到的这个y值有什么用呢
我们可以通过这个预测的y值和实际的y值进行比较,或者画roc曲线,进而评价模型的优劣
我们暂时先停在这里 使用另外一种方法来确定lammada值 叫做交叉验证法Cross-validation
因为上述的从50个lammada值中 选择最终的lammada过程中具有很大的主观性。那么有没有什么方法可以让软件来做这个事情呢 所以各种大佬就发明了交叉验证的办法 此时就使用交叉验证函数cv.glmnet()
The function glmnet returns a sequence of models for the users to choose from. In many cases, users may prefer the software to select one of them. Cross-validation is perhaps the simplest and most widely used method for that task. cv.glmnet is the main function to do cross-validation here, along with various supporting methods such as plotting and prediction.
?plot.cv.glmnet
#主要在做交叉验证,lasso。nfold默认为10.取9份进行模型拟合,剩下一份进行验证。
#然后取一份进行拟合,剩下9份进行验证。这叫交叉验证
cv_fit <- cv.glmnet(x=x, y=y, alpha = 1, nlambda = 1000, type.measure='deviance')
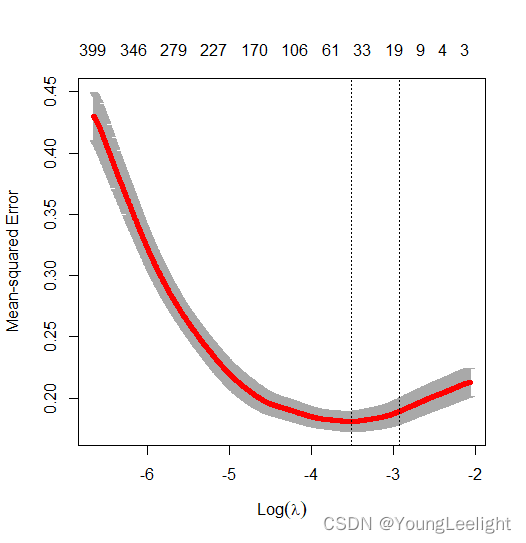
plot_cv.glmnet(cv_fit)
plot(cv_fit)
这个产生的cv_fit是一个含有交叉验证所有结果的列表
可以把交叉验证的内容 画出来,看看怎么确定lammda值


注意看到图中有两个虚线
获取lambda.min的值
lambda.min is the value of λ that gives minimum mean cross-validated error
cv_fit
cv_fit$lambda.1se
cv_fit$lambda.min
查看当lammda值取lambda.min时,β系数的取值 这里看到有的基因没有β值,就表示它对模型的贡献很小,可以省略。 这些基因可以被过滤掉。这也就是我们常说的使用lasso回归来进行特征选择。利用lasoo回归把β系数值非常小的基因去掉。进而得到特征基因,可以利用这些特征基因进行cox多因素回归分析。
**
coef(cv_fit, s="lambda.min") #查看当lammda值取lambda.min时,β系数的取值
head(coef(cv_fit,s='lambda.min'))

此时我们可以根据创建好的交叉验证模型来预测新变量的y值,此时指定交叉验证模型的lammada值为lambda.min
dim(x)
head(x)[,1:3]
nx<-matrix(rnorm(5 * 552), 5, 552)
predict(cv_fit, newx = nx, s = c(cv_fit$lambda.min, 0.001278))
下图中表示使用cv_fit模型,指定lammada值为lambda.min 和0.001278,所产生的y值预测结果
s1列表示lammada值为lambda.min 所产生的y值预测结果
s2列表示lammada值为0.001278 所产生的y值预测结果
这时候我们可以查看交叉验证回归得到的结果
lasso.prob <- predict(cv_fit, newx=x , s=c(cv_fit$lambda.min,cv_fit$lambda.1se) )
head(lasso.prob)

re=cbind(y ,lasso.prob)
head(re)
dat=as.data.frame(re[,1:2])
head(dat)
colnames(dat)=c('event','prob')
dat$event=as.factor(dat$event)
head(dat)
library(ggpubr)
p <- ggboxplot(dat, x = "event", y = "prob",
               color = "event", palette = "jco",
               add = "jitter")
#  Add p-value
p + stat_compare_means()
如果因变量是二分类变量 那么s1列对应的列指的就是模型预测的可能性
如果因变量是连续性变量 那么s1列对应的值就应该是模型的预测值
ggboxplot(dat, x = "event", y = "prob",
          color = "event", palette = "jco",
          add = "jitter",label = FALSE)
计算ROC曲线 预测值对真实值的预测效力究竟如何呢
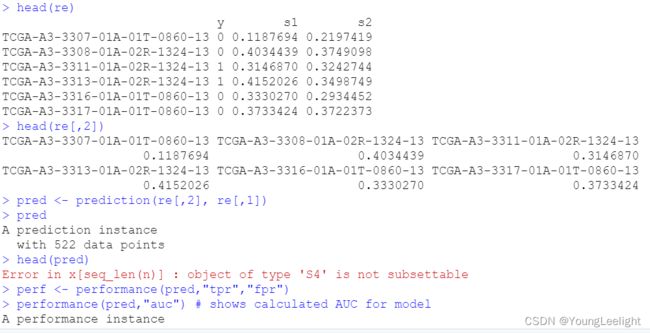
head(re)
head(re[,2])
pred <- prediction(re[,2], re[,1])
pred
perf <- performance(pred,"tpr","fpr")

performance(pred,"auc") # shows calculated AUC for model
plot(perf,colorize=FALSE, col="black") # plot ROC curve
lines(c(0,1),c(0,1),col = "gray", lty = 4 )

ROC curves for binomial data
In the special case of binomial models, users often would like to see the ROC curve for validation or test data. Here the function roc.glmnet provides the goodies. Its first argument is as in assess.glmnet. Here we illustrate one use case, using the prevlidated CV fit.
cfit <- cv.glmnet(x, y, family = "binomial", type.measure = "auc",
                  keep = TRUE)
rocs <- roc.glmnet(cfit$fit.preval, newy = y)

roc.glmnet returns a list of cross-validated ROC data, one for each model along
the path. The code below demonstrates how one can plot the output.
The first line identifies the lambda value giving the best area
 under the curve (AUC). Then we plot all the ROC curves in grey
 and the “winner” in red.

best <- cvfit$index["min",]
plot(rocs[[best]], type = "l")
invisible(sapply(rocs, lines, col="grey"))
lines(rocs[[best]], lwd = 2,col = "red")
总结一下:小结一下
**那么得到的这个y值有什么用呢
1 我们可以通过这个预测的y值和实际的y值进行比较,
2 或者画roc曲线,进而评价模型的优劣
3 还可以看不同lammada取值时,不同预测结果之间的偏差**
查看当lammda值取lambda.min时,β系数的取值 可以看到有的基因没有β值,就表示它对模型的贡献很小,可以省略。 这些基因可以被过滤掉。
第三部分。如果我的目的不是建立模型,我只是想使用lasso回归来进行特征选择,应该怎么做呢
前面两部分,我们都可以使用类似于下面这段代码来查看 特定lammada值是,模型所对应的β系数
coef(model_lasso, s=c(model_lasso$lambda[29],0.009))
通过对结果观察我们可以看到,有的基因没有β值,就表示它对模型的贡献很小,可以省略。 这些基因可以被过滤掉。这也就是我们常说的使用lasso回归来进行特征选择。利用lasoo回归把β系数值非常小的基因去掉。进而得到特征基因,可以利用这些特征基因进行cox多因素回归分析。
我们就可以根据以上情况,选择特定的lammada值,然后确定该值下的特征基因
lasso特征选择之后,再做cox回归分析
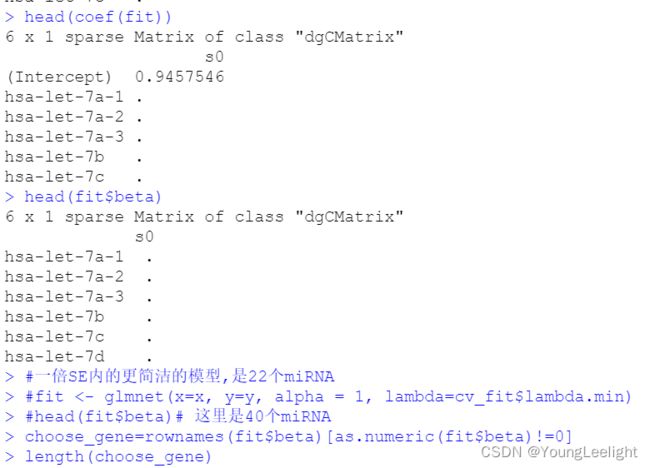
fit <- glmnet(x=x, y=y, alpha = 1, lambda=cv_fit$lambda.1se)
head(coef(fit))
head(fit$beta)
#一倍SE内的更简洁的模型,是22个miRNA
#fit <- glmnet(x=x, y=y, alpha = 1, lambda=cv_fit$lambda.min)
#head(fit$beta)# 这里是40个miRNA
choose_gene=rownames(fit$beta)[as.numeric(fit$beta)!=0]
length(choose_gene)
myexpr=x[,choose_gene]
mysurv=phe[,c("days","event")]

mysurv$days[mysurv$days< 1] = 1

head(myexpr)
head(mysurv)
# 详细代码参见这个网站https://github.com/jeffwong/glmnet/blob/master/R/coxnet.R#
fit <- glmnet( myexpr, Surv(mysurv$days,mysurv$event),
              family = "cox")
#用包自带的函数画图
plot(fit, xvar="lambda", label = TRUE)
plot(fit, label = TRUE)
## 如果需要打印基因名,需要修改函数,这里不展开。
#head(fit$beta)# 这里是40个miRNA
choose_gene=rownames(fit$beta)[as.numeric(fit$beta)!=0]
length(choose_gene)


