哈佛大学单细胞课程|笔记汇总 (九)
哈佛大学单细胞课程|笔记汇总 (七)
哈佛大学单细胞课程|笔记汇总 (八)
(九)Single-cell RNA-seq marker identification
对于上面提到的3个问题,我们可以使用Seurat探索3种不同类型的标记识别来解答。每种都有自己的优点和缺点:
识别每个cluster的markers:
此分析将每个cluster与所有其他cluster进行比较,并输出差异表达/存在的基因。
可用于识别未知cluster并提高对假定细胞类型的信心
鉴定每个cluster的保守markers:
如果使用的单细胞数据来源于不同的样品(如对照、处理,健康和疾病,每个算一种条件),该分析首先寻找在各个条件下不同簇之间差异表达/存在的基因,然后报告所有条件下的簇之间总体差异表达/存在的基因。
这些基因可以帮助找出clusters的身份。
-
在不止一种条件下有用,可识别在各种条件下保守的细胞类型标记。
特定cluster之间的标记鉴定:
该分析探索了特定cluster之间差异表达的基因。
-
对于确定相同细胞类型(即具有相似标记的clusters)之间的基因表达差异很有用
识别每个cluster的marker
在Seurat中,对每个cluster进行marker识别是通过
FindAllMarkers()函数进行,需要对该cluster与其他clusters进行比较,将每个cluster中的细胞视为重复样品,并通过某种统计学检验进行差异表达分析(默认方法为Wilcoxon Rank Sum test)。在
FindAllMarkers()函数中有3个重要的变量可以决定某个基因是否为一个marker:logfc.threshold: 相对于其他clusters平均表达的变化倍数值,取log2。默认值为0.25。-
如果平均log2FC不满足阈值,则可能会错过只在目标簇中一小部分细胞表达,但不在其他簇中表达的细胞标记。
由于不同细胞类型的代谢输出存在细微差异,可能会返回许多代谢/核糖体基因,这对于区分细胞类型身份没有帮助。
min.diff.pct: 某个cluster中表达基因的细胞百分比与其他所有clusters中该表达基因的细胞百分比之间的最小百分比差异。-
可能会错过在所有细胞中表达但在特定细胞类型中高度上调的那些细胞标志物。
min.pct: 在两个clusters中任一clusters的最少比例细胞中检测到的基因。默认值为0.1。-
如果将其设置为非常高的值,则可能会导致许多假阴性,原因是并非在所有细胞中都检测到了所有基因(即使它已被表达)。
可以根据需要的严格程度使用这些参数的任意组合。同样,默认情况下,此函数将返回正向和负向表达变化的基因。我们可以使用
only.pos观察阳性变化。下面的是查找每个cluster标记的代码:## DO NOT RUN THIS CODE ## # Find markers for every cluster compared to all remaining cells, report only the positive ones markers <- FindAllMarkers(object = seurat_integrated, only.pos = TRUE, logfc.threshold = 0.25)NOTE: This command can quite take long to run, as it is processing each individual cluster against all other cells.
在不同条件下识别保守marker
由于使用的数据集中有不同条件的样本,因此最好的选择是找到保守标记。对应的函数需要在内部按样本组/条件分离出细胞,然后针对单个指定聚类执行差异基因表达测试。针对每种条件计算基因水平的p值,然后使用
MetaDER软件包中的meta-analysis方法跨组进行组合。在开始标记识别之前,我们将明确设置使用原始计数而不是整合数据。
DefaultAssay(seurat_integrated) <- "RNA"NOTE: Although the default setting for this function is to fetch data from the “RNA” slot, we encourage you to run this line of code above to be absolutely sure in case the active slot was changed somewhere upstream in your analysis. The raw and normalized counts are stored in this slot, and the functions for finding markers will automatically pull the raw counts.
函数
FindConservedMarkers()有着以下结构:FindConservedMarkers() syntax:
FindConservedMarkers(seurat_integrated,
                     ident.1 = cluster,
                     grouping.var = "sample",
                     only.pos = TRUE,
             min.diff.pct = 0.25,
                     min.pct = 0.25,
             logfc.threshold = 0.25)
FindConservedMarkers的一些参数在函数
FindAllMarkers()中也存在且功能一致。FindConservedMarkers()中的特殊的参数有:ident.1:此参数表示一次仅评估一个cluster;grouping.var:metadata中的变量(列标题),标记细胞对应的样品来源;举个例子!(我们的分析将比较宽容,仅使用大于0.25的log2变化倍数值。我们还将指定返回每个cluster的唯一正marker。)
cluster0_conserved_markers <- FindConservedMarkers(seurat_integrated,
                              ident.1 = 0,
                               grouping.var = "sample",
                              only.pos = TRUE,
                      logfc.threshold = 0.25)
在
FindConservedMarkers()函数输出的变量:gene: gene symbol
condition_p_val: p-value not adjusted for multiple test correction for condition
condition_avg_logFC: average log2 fold change for condition. Positive values indicate that the gene is more highly expressed in the cluster.
condition_pct.1: percentage of cells where the gene is detected in the cluster for condition
condition_pct.2: percentage of cells where the gene is detected on average in the other clusters for condition
condition_p_val_adj: adjusted p-value for condition, based on bonferroni correction using all genes in the dataset, used to determine significance
max_pval: largest p value of p value calculated by each group/condition
minimump_p_val: combined p value
NOTE: Since each cell is being treated as a replicate this will result in inflated p-values within each group! A gene may have an incredibly low p-value < 1e-50 but that doesn’t translate as a highly reliable marker gene.
当查看输出结果时,建议寻找
pct.1和pct.2之间表达差异较大且倍数变化较大的高变基因。例如,如果pct.1 = 0.90并且pct.2 = 0.80,则结果可能不会像marker那样令人兴奋。当pct.2 = 0.1时,较大的差异将更具说服力。而是否大多数表达标记的细胞都在感兴趣的cluster中,这一点是最让人感兴趣的。如果pct.1较低,例如0.3,则结果可能不会那么有趣了。添加基因注释
在列中添加基因注释信息,可以点击此处的链接(https://github.com/hbctraining/scRNA-seq/raw/master/data/annotation.csv)下载注释文件到`data`文件夹。
annotations <- read.csv("data/annotation.csv")NOTE: If you are interested in knowing how we obtained this annotation file, take a look at the linked materials(https://github.com/hbctraining/scRNA-seq/blob/master/lessons/fetching_annotations.md).
首先,将带有基因标识符的行名变成我们的列。然后将该注释文件与
FindConservedMarkers()的结果合并:# Combine markers with gene descriptions cluster0_ann_markers <- cluster0_conserved_markers %>% rownames_to_column(var="gene") %>% left_join(y = unique(annotations[, c("gene_name", "description")]), by = c("gene" = "gene_name")) View(cluster0_ann_markers)运行多个样本
为了有效的进行marker识别,我们写了一个函数:
Run the
FindConservedMarkers()functionTransfer row names to a column using
rownames_to_column()functionMerge in annotations
Create the column of cluster IDs using the
cbind()function
# Create function to get conserved markers for any given cluster
get_conserved <- function(cluster){
  FindConservedMarkers(seurat_integrated,
                       ident.1 = cluster,
                       grouping.var = "sample",
                       only.pos = TRUE) %>%
    rownames_to_column(var = "gene") %>%
    left_join(y = unique(annotations[, c("gene_name", "description")]),
               by = c("gene" = "gene_name")) %>%
    cbind(cluster_id = cluster, .)
  }
这里完成了此函数的创建,可以将其用作适当的
map函数的参数。保证map系列函数的输出是一个数据框,每个cluster输出均由行绑定在一起,我们将使用map_dfr()函数执行此操作。map family syntax:
map_dfr(inputs_to_function, name_of_function)现在使用这个函数找到之前未识别细胞类型的簇(cluster7 and cluster 20)的保守基因。
# Iterate function across desired clusters
conserved_markers <- map_dfr(c(7,20), get_conserved)
Finding markers for all clustersFor your data, you may want to run this function on all clusters, in which case you could input 0:20 instead of c(7,20); however, it would take quite a while to run. Also, it is possible that when you run this function on all clusters, in some cases you will have clusters that do not have enough cells for a particular group - and your function will fail. For these clusters you will need to use FindAllMarkers().
评估marker genes
我们希望使用这些基因列表来识别这些clusters的细胞类型。我们可以看一下每个cluster的top基因看是否有任何提示。我们可以按两组的平均倍数变化查看前10个marker:
# Extract top 10 markers per cluster top10 <- conserved_markers %>% mutate(avg_fc = (ctrl_avg_logFC + stim_avg_logFC) /2) %>% group_by(cluster_id) %>% top_n(n = 10, wt = avg_fc) # Visualize top 10 markers per cluster View(top10)我们发现cluster 7出现了许多热休克和DNA损伤基因。基于这些标记,cluster 7可能是应激或垂死的细胞。但当我们更详细地研究这些细胞的质量指标(即
mitoRatio和nUMI)后,我们发现看不到支持该结论的实际数据。同时如果我们更仔细地观察标记基因列表,我们还会发现一些与T细胞相关的基因和激活标记基因,则cluster 7可能是活化的(细胞毒性)T细胞。而且已经有了广泛的研究支持热休克蛋白与反应性T细胞在慢性炎症中诱导抗炎细胞因子的结合。因此在这个cluster中,我们需要对免疫细胞有更深入的了解,才能真正弄清结果并得出最终结论。在cluster 20中我们并没有看见某个主题功能的基因富集,然后作者在
pct.1vs.pct.2发现一个基因TPSB2,它在cluster 20 中高表达,在其他的clusters中表达水平较低。此时我们谷歌这个基因会得到网站GeneCards ebsite(https://www.genecards.org/cgi-bin/carddisp.pl?gene=TPSB2&keywords=TPSB2):“Beta tryptases appear to be the main isoenzymes expressed in mast cells, whereas in basophils, alpha-tryptases predominate. Tryptases have been implicated as mediators in the pathogenesis of asthma and other allergic and inflammatory disorders.”
因此,cluster 20可能代表肥大细胞。肥大细胞既是免疫系统的重要细胞,也是造血细胞系的重要细胞。研究发现,肥大细胞明显富含丝氨酸蛋白酶,例如
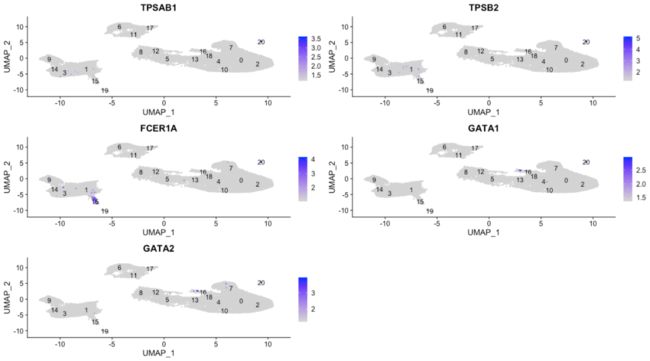
TPSAB1和TPSB2,两者均出现在我们的保守marker中。另一个不是丝氨酸蛋白酶的基因,而是已知的肥大细胞特异性基因,出现在我们的基因列表中的是FCER1A(编码IgE受体的亚基)。此外,我们看到GATA1和GATA2出现在我们的列表中,它们不是肥大细胞标记基因,但是在肥大细胞中大量表达,并且是调节各种肥大细胞特异性基因的已知转录因子(Cell重磅综述:关于人类转录因子,你想知道的都在这)。marker 基因可视化
我们以cluster 20的marker基因为例:
# Plot interesting marker gene expression for cluster 20
FeaturePlot(object = seurat_integrated,
                        features = c("TPSAB1", "TPSB2", "FCER1A", "GATA1", "GATA2"),
                         sort.cell = TRUE,
                         min.cutoff = 'q10',
                         label = TRUE,
             repel = TRUE)
也可以使用violinplot:
Violin plots are similar to box plots, except that they also show the probability density of the data at different values, usually smoothed by a kernel density estimator. A violin plot is more informative than a plain box plot. While a box plot only shows summary statistics such as mean/median and interquartile ranges, the violin plot shows the full distribution of the data. The difference is particularly useful when the data distribution is multimodal (more than one peak). In this case a violin plot shows the presence of different peaks, their position and relative amplitude.
# Vln plot - cluster 20
VlnPlot(object = seurat_integrated,
        features = c("TPSAB1", "TPSB2", "FCER1A", "GATA1", "GATA2"))
这些结果和图可以帮助我们确定这些clusters的身份,或者在先前探索了预期细胞类型的标准标记后验证假设身份。
标记为相同细胞类型的不同cluster之间的marker基因
关于分析的最后一组问题涉及与相同细胞类型相对应的cluster是否具有生物学上有意义的差异。有时返回的标记列表不能充分分隔某些cluster。比如我们先期已经知道
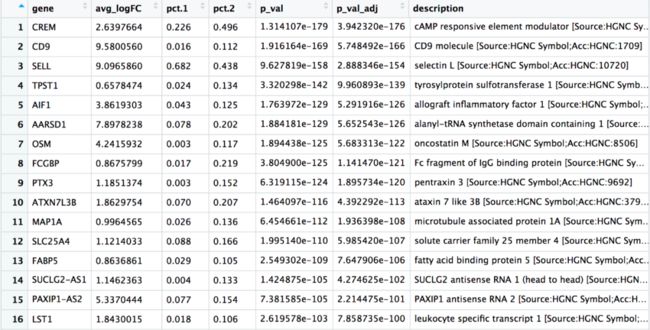
clusters 0, 2, 4, 10, 和18均为CD4+ T cells,那么他们之间是否具有一定的生物学差异呢?FindMarkers()函数可以对两组clusters进行对比分析,我们以cluster 2为例:# Determine differentiating markers for CD4+ T cell cd4_tcells <- FindMarkers(seurat_integrated, ident.1 = 2, ident.2 = c(0,4,10,18)) # Add gene symbols to the DE table cd4_tcells <- cd4_tcells %>% rownames_to_column(var = "gene") %>% left_join(y = unique(annotations[, c("gene_name", "description")]), by = c("gene" = "gene_name")) # Reorder columns and sort by padj cd4_tcells <- cd4_tcells[, c(1, 3:5,2,6:7)] cd4_tcells <- cd4_tcells %>% dplyr::arrange(p_val_adj) # View data View(cd4_tcells)在这些最重要的基因中,
CREM基因是激活标记,另一个激活的标记是CD69,而幼稚或记忆细胞的标记包括SELL和CCR7基因。有趣的是,SELL基因也位于列表的顶部。让我们使用这些新的细胞状态marker探索一下激活状态:# Plot gene markers of activated and naive/memory T cells FeaturePlot(seurat_integrated, reduction = "umap", features = c("CREM", "CD69", "CCR7", "SELL"), label = TRUE, sort.cell = TRUE, min.cutoff = 'q10', repel = TRUE )根据这些图,
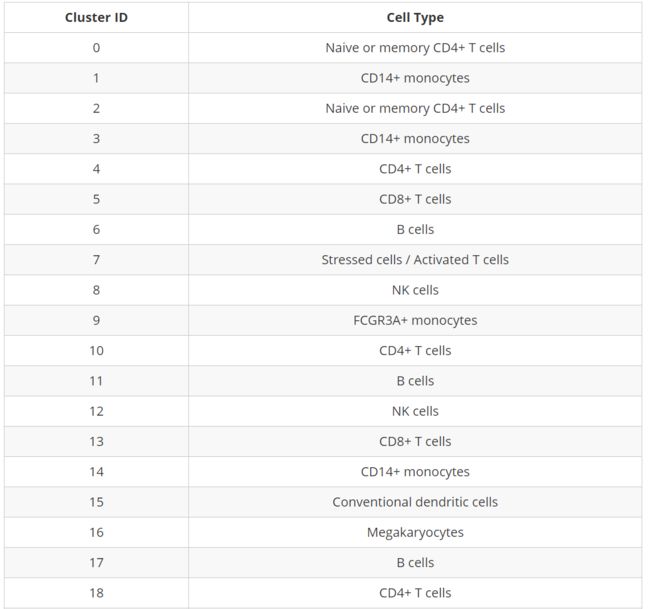
cluster 0和2确实是幼稚T细胞。但是很难分辨是否是激活的T细胞。cluster 4和18可以说是活化的T细胞,但CD69的表达不如CREM明显。之后我们将其标记为幼稚T细胞,并且将其余的clusters标记为CD4 + T细胞。现在利用以上所有这些信息,我们可以推测不同clusters的细胞类型,并使用细胞类型标签绘制细胞
我们对细胞进行重新命名:
# Rename all identities
seurat_integrated <- RenameIdents(object = seurat_integrated,
                               "0" = "Naive or memory CD4+ T cells",
                               "1" = "CD14+ monocytes",
                               "2" = "Naive or memory CD4+ T cells",
                               "3" = "CD14+ monocytes",
                               "4" = "CD4+ T cells",
                               "5" = "CD8+ T cells",
                               "6" = "B cells",
                               "7" = "Stressed cells / Activated T cells",
                               "8" = "NK cells",
                               "9" = "FCGR3A+ monocytes",
                               "10" = "CD4+ T cells",
                               "11" = "B cells",
                               "12" = "NK cells",
                               "13" = "CD8+ T cells",
                               "14" = "CD14+ monocytes",
                               "15" = "Conventional dendritic cells",
                   "16" = "Megakaryocytes",
                   "17" = "B cells",
                   "18" = "CD4+ T cells",
                   "19" = "Plasmacytoid dendritic cells",
                   "20" = "Mast cells")

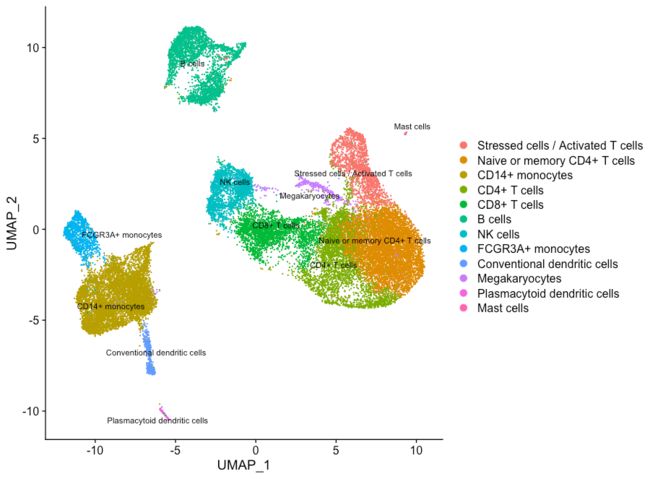
# Plot the UMAP
DimPlot(object = seurat_integrated,
        reduction = "umap",
        label = TRUE,
        label.size = 3,
        repel = TRUE)
保存:
# Save final R object
write_rds(seurat_integrated,
          path = "results/seurat_labelled.rds")
现在我们已经定义了clusters并为每个cluster进行了标记,我们有一些不同的选择:
通过实验验证识别出细胞类型的有趣marker。
在
ctrl和stim组之间进行差异表达分析-
要进行此分析,必须进行生物学复制,并且还要有其他材料可以帮助完成此分析(https://github.com/hbctraining/scRNA-seq/blob/master/lessons/pseudobulk_DESeq2_scrnaseq.md)。
如果试图确定细胞类型或细胞状态之间的进程,可以执行轨迹分析或谱系追踪。
例如探索以下任何一种:
-
分化过程;
随着时间的表达变化;
细胞状态改变时的表达变化。
往期精品(点击图片直达文字对应教程)


后台回复“生信宝典福利第一波”或点击阅读原文获取教程合集


