【毕业设计】机器学习的员工离职模型研究-python
目录
前言
课题背景和意义
实现技术思路
变量分析
数据导入
构建机器学习模型
1. 1 复制数据删除不需要的变量
1.2 列变量属性分类
实现效果图样例
前言
大四是整个大学期间最忙碌的时光,一边要忙着备考或实习为毕业后面临的就业升学做准备,一边要为毕业设计耗费大量精力。近几年各个学校要求的毕设项目越来越难,有不少课题是研究生级别难度的,对本科同学来说是充满挑战。为帮助大家顺利通过和节省时间与精力投入到更重要的就业和考试中去,学长分享优质的选题经验和毕设项目与技术思路。
对毕设有任何疑问都可以问学长哦!
本次分享的课题是
机器学习的员工离职模型研究-python
课题背景和意义
员工流失(employee attrition)是困扰企业的众多关键问题之一。其与员工基础信息、收入、晋升、满意度、绩效和工作与生活平衡等相关的变量等密切相关。
人力资源部门负责分析导致员工流失的因素,并探索各个变量的影响程度。他们希望能够通过有效的机器学习算法构建模型,用于预测员工是否要辞职。
员工流失的建模与预测,将有助于减少员工流失,辅助人力资源团队进行关键的干预工作,让管理层明确哪些因素影响了“留人”,反过来促进企业更好地“选人”、“育人”、“用人”。
实现技术思路
变量分析
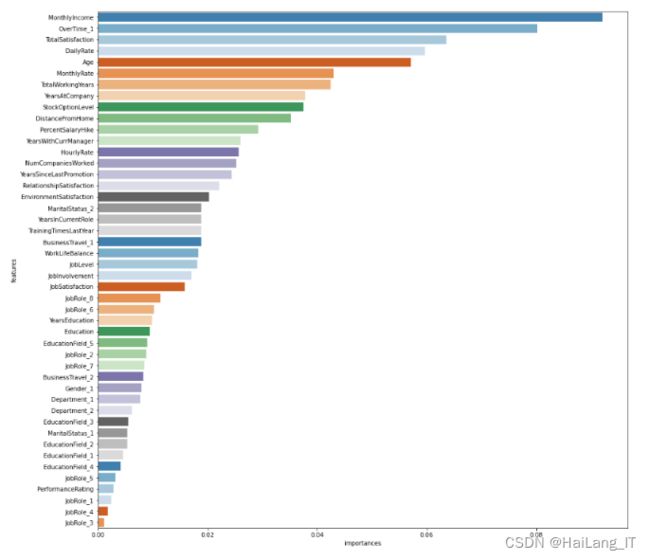
变量属性包括:性别、年龄、学历、任职过的企业数量、工龄、婚姻状况、在公司工作的时间、职位、职位等级、月收入、工作投入、效绩评分、员工优先认股权、涨薪百分比、上一年培训次数、环境满意度、关系满意度、工作生活平衡、上班离家距离、是否加班、出差情况
数据导入
# 加载库
import pandas as pd
import seaborn as sns
import numpy as np
import matplotlib.pyplot as plt
from sklearn.preprocessing import LabelEncoder,StandardScaler,MinMaxScaler
from sklearn.cluster import KMeans
import time
from sklearn.model_selection import train_test_split,StratifiedKFold,GridSearchCV
from sklearn.metrics import classification_report , confusion_matrix ,f1_score,accuracy_score
from imblearn.over_sampling import SMOTENC
from sklearn.tree import DecisionTreeClassifier
from sklearn.neighbors import KNeighborsClassifier
from sklearn.ensemble import BaggingClassifier,AdaBoostClassifier , RandomForestClassifier , StackingClassifier,ExtraTreesClassifier,GradientBoostingClassifier
from sklearn.linear_model import LogisticRegression
from sklearn.discriminant_analysis import LinearDiscriminantAnalysis
from sklearn.feature_selection import RFE
import scipy.stats as stats
from sklearn.neural_network import MLPClassifier
from sklearn.svm import SVC
# import squarify

import warnings
warnings.filterwarnings('ignore')
构建机器学习模型
一、模型预处理
Model preparation
1. 1 复制数据删除不需要的变量
# 1. 1 复制数据删除不需要的变量
MLdata = df.copy()
MLdata.drop(['Over18','EmployeeCount','EmployeeNumber','StandardHours'], axis = 1, inplace = True)
1.2 列变量属性分类
# 1.2 列变量属性分类
cols_cat = ['Education', 'EnvironmentSatisfaction', 'JobInvolvement', 'JobLevel', 'JobSatisfaction', 'PerformanceRating', 'RelationshipSatisfaction', 'StockOptionLevel', 'WorkLifeBalance']
cols_cat_not_ord = ['BusinessTravel', 'Department', 'EducationField', 'Gender', 'JobRole', 'MaritalStatus', 'OverTime']
cols_num = ['Age', 'DailyRate', 'DistanceFromHome', 'HourlyRate', 'MonthlyIncome', 'MonthlyRate', 'NumCompaniesWorked', 'PercentSalaryHike', 'TotalWorkingYears', 'TrainingTimesLastYear', 'YearsAtCompany', 'YearsInCurrentRole', 'YearsSinceLastPromotion', 'YearsWithCurrManager']

cols_feat = cols_cat + cols_cat_not_ord + cols_num
col_target = ['Attrition'] # Yes/No
将列变量分为3类:
-
有序分类变量cols_cat;
-
无序分类变量cols_cat_not_ord;
-
数值型变量cols_num;
样本不平衡问题的处理
可以看到,对于目标特征员工离职(Attrition),其样本是不平衡的
# 1.10 样本不平衡问题的处理
# 使用SMOTE处理样本不平衡Oversampling 并可视化
fig, axes = plt.subplots(1, 2, figsize=(16, 4))
sns.countplot(ax = axes[0], data = pd.DataFrame(y),x='Attrition', color="c");

cols_cat_idx = [i for (i, col) in enumerate(X.columns) if col in (cols_cat + cols_cat_not_ord)]

oversample = SMOTENC(categorical_features = cols_cat_idx, random_state=SEED)
X_train, y_train = oversample.fit_resample(X_train, y_train)

sns.countplot(ax = axes[1], data = pd.DataFrame(y_train), x = 'Attrition', color="c")
plt.show()
实现效果图样例
我是海浪学长,创作不易,欢迎点赞、关注、收藏、留言。
毕设帮助,疑难解答,欢迎打扰!
