吴恩达机器学习课后作业ex3(python实现)
ex3是机器学习中经典的手写数字识别(使用逻辑回归分类),给出的数据是.mat后缀,可以用python中load方法加载数据。手写体“1”到“9”的类别分别标为1-9,“0”被标记为10。
这里先随机抽取100个手写体绘图出来查看。
import scipy.io as scio
import numpy as np
import matplotlib.pyplot as plt


path = 'ex3data1.mat'
data = scio.loadmat(path)
# 随机选取100个展示
sample_idx = np.random.choice(np.arange(len(data['X'])), 100)
sample_image = data['X'][sample_idx, :]

fig, ax_array = plt.subplots(nrows=10, ncols=10, figsize=(12, 12))
for r in range(10):
    for c in range(10):
        ax_array[r, c].matshow(np.array(sample_image[10 * r + c].reshape((20, 20))).T)
        plt.xticks(np.array([]))
        plt.yticks(np.array([]))
plt.show()
ex3作业运用的模型依旧是逻辑回归,不过也可以使用人工神经网络(手写体识别用的多的是人工神经网络),所以我觉得ex3应该是一个过渡,ex4中用的是人工神经网络,包括作业最后也提了人工神经网络,也给了人工神经网络的模型训练结果供大家了解,其实也可以将逻辑回归看成一个没有隐藏层的人工神经网络。
手动实现函数:
# sigmoid函数
def sigmoid(z):
    return 1 / (1 + np.exp(-z))


# 损失函数
def cost(theta, X, Y, learningRate):
    theta = np.matrix(theta)
    X = np.matrix(X)
    Y = np.matrix(Y)
    first = np.multiply(-Y, np.log(sigmoid(np.dot(X, theta.T))))
    second = np.multiply((1 - y), np.log(1 - sigmoid(np.dot(X, theta.T))))
    reg = (learningRate / (2 * len(X))) * np.sum(np.power(theta[:, 1:theta.shape[1]], 2))
    return np.sum(first - second) / len(X) + reg


# 梯度下降
def gradient(theta, X, Y, learningRate):
    theta = np.matrix(theta).T
    h = sigmoid(np.dot(X, theta))
    error = h - Y
    grad = (np.dot(X.T, error) / len(X)) + ((learningRate / len(X)) * theta)
    grad[0, 0] = np.dot(X[:, 0].T, error) / len(X)
    return np.array(grad).ravel()
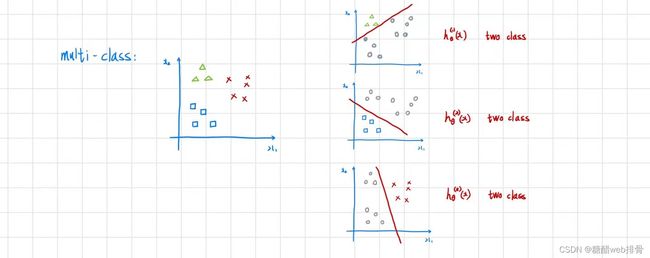
多分类问题即是针对不同类别进行0-1分类,最后选取分类概率最大的类别,如下图:
例如识别手写体“1”时,将手写体“0”,“2”,···等的y设为0,手写体“1”设为1。
每个图像是400维的向量,所以输入维度为400,输出0或1(这里其实是十个模型,分别识别是否为手写体“1”、“2”、···,选择概率最大的结果)。
训练模型表现:
可以看出精确度还不错,为94%(ex4中使用人工神经网络实现,针对此类数据,人工神经网络的精确度会更高)。
源码:
import scipy.io as scio
import numpy as np
import matplotlib.pyplot as plt
from scipy.optimize import minimize
from sklearn.metrics import classification_report


path = 'ex3data1.mat'
data = scio.loadmat(path)
# 随机选取100个展示
sample_idx = np.random.choice(np.arange(len(data['X'])), 100)
sample_image = data['X'][sample_idx, :]

fig, ax_array = plt.subplots(nrows=10, ncols=10, figsize=(12, 12))
for r in range(10):
    for c in range(10):
        ax_array[r, c].matshow(np.array(sample_image[10 * r + c].reshape((20, 20))).T)
        plt.xticks(np.array([]))
        plt.yticks(np.array([]))
plt.show()


# sigmoid函数
def sigmoid(z):
    return 1 / (1 + np.exp(-z))


# 损失函数
def cost(theta, X, Y, learningRate):
    theta = np.matrix(theta)
    X = np.matrix(X)
    Y = np.matrix(Y)
    first = np.multiply(-Y, np.log(sigmoid(np.dot(X, theta.T))))
    second = np.multiply((1 - y), np.log(1 - sigmoid(np.dot(X, theta.T))))
    reg = (learningRate / (2 * len(X))) * np.sum(np.power(theta[:, 1:theta.shape[1]], 2))
    return np.sum(first - second) / len(X) + reg


# 梯度下降
def gradient(theta, X, Y, learningRate):
    theta = np.matrix(theta).T
    h = sigmoid(np.dot(X, theta))
    error = h - Y
    grad = (np.dot(X.T, error) / len(X)) + ((learningRate / len(X)) * theta)
    grad[0, 0] = np.dot(X[:, 0].T, error) / len(X)
    return np.array(grad).ravel()


# 属性
learningRate = 1
input_size = 401
output_size = 10

# 初始化x和y
x = np.insert(data['X'], 0, np.ones(data['X'].shape[0]), axis=1)
# 参数
res = np.zeros((input_size, output_size))
# 多分类拟合过程
for i in range(1, output_size+1):
    y = [1 if data['y'][j] == i else 0 for j in range(len(data['y']))]
    y = np.matrix(y).T
    theta = np.zeros(input_size)
    print(cost(theta, x, y, learningRate))
    fmin = minimize(fun=cost, x0=theta, args=(x, y, learningRate), method='TNC', jac=gradient)
    print(cost(fmin.x, x, y, learningRate))
    res[:, i-1] = fmin.x

print(res)
print(res.shape)

num_labels = res.shape[0]
h = sigmoid(np.dot(x, res))
pred = np.argmax(h, axis=1)
pred = pred + 1
print(pred)

print(classification_report(data['y'], pred))


